Peptide stability data live primarily in curated repositories like PEPlife2, which covers 1,673 unique sequences with half-life values, assay conditions, and matrix details. Pull a dataset filtered to your matrix of interest (plasma, serum, or buffer), then cross-check candidate sequences with a predictive model such as PepMSND before committing bench time. The fastest validation path is a short plasma or serum incubation assay run against your top predicted hits, since public data rarely matches your exact formulation or lab conditions.
TL;DR:
- Species differences greatly impact peptide half-life, so cross-species data should be treated as directional rather than directly interchangeable for human applications.
- Peptides rich in hydrophobic residues, tryptophan, or tyrosine, especially at exposed positions, are more prone to proteolytic cleavage and oxidation.
- Stabilization is often achieved through pH adjustment, excipients, covalent modifications, or chemical alterations like PEGylation, with formulation changes needing separate validation.
- Standardized reporting of stability data—including assay conditions, confidence intervals, and raw data—is essential for reproducibility and model validation across laboratories.
Table of Contents
- Which Repositories Hold Usable Peptide Stability Data?
- What Actually Degrades a Peptide, and Which Sequences Are Most at Risk?
- How Do You Design a Peptide Stability Assay That Actually Works?
- Which Analytical Platform Gives You the Most Reliable Stability Data?
- Can Predictive Models Replace Experimental Stability Testing?
- What Formulation Changes Actually Extend Peptide Shelf Life?
- How Should Peptide Stability Data Be Reported for Reuse?
- Why Blank Peptides Backs Every Batch With Verifiable Data
- Why Standardized Stability Data Matters More Than Another Model
- Get Batch-Verified Peptides for Your Next Stability Study
- Sources
- FAQ
Which Repositories Hold Usable Peptide Stability Data?
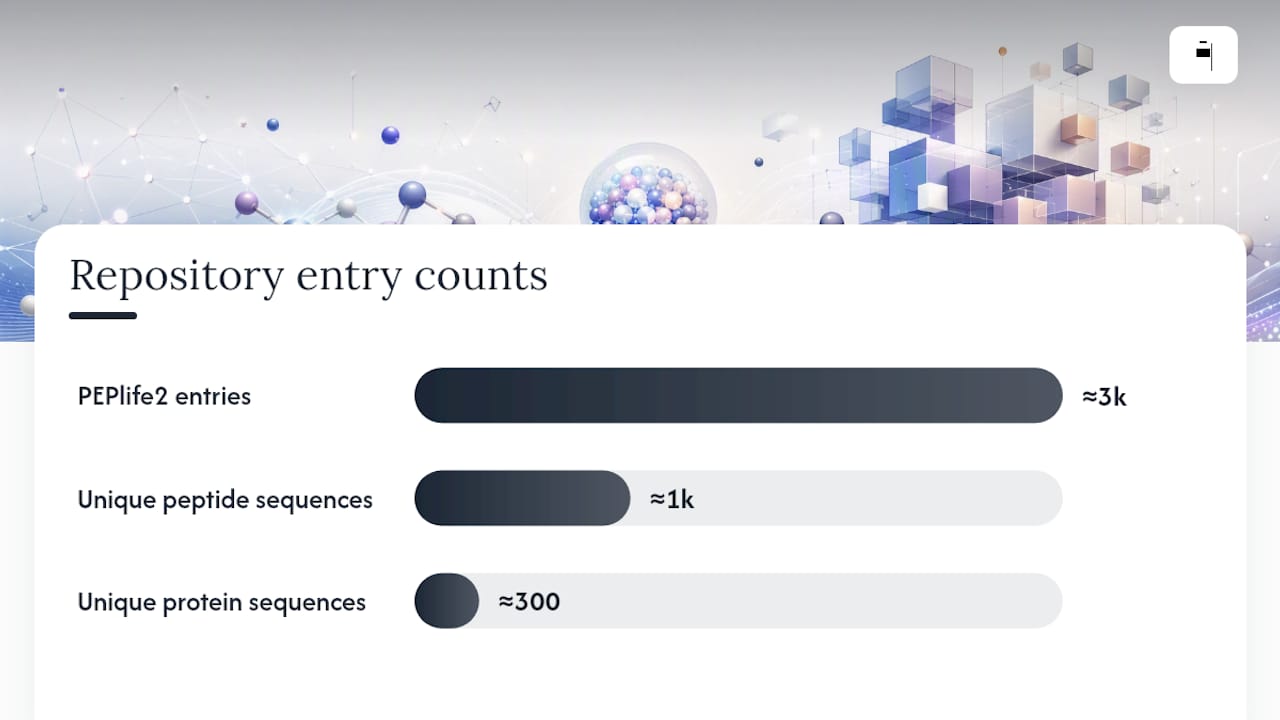
PEPlife2 is the closest thing the field has to a central clearinghouse. It holds roughly a few thousand entries spanning over a thousand unique peptide sequences and a few hundred unique protein sequences, each tagged with half-life values, assay matrix, and (where available) the enzymatic or chemical conditions under which degradation was measured. You can query it by sequence, by source protein, or by stability class, which makes it genuinely useful for building training sets or spot-checking a candidate before you order synthesis.
The catch is metadata completeness. Not every entry lists temperature, pH, or peptide concentration, and older entries pulled from legacy literature sometimes report half-life without specifying whether the matrix was human, rat, or mouse plasma. Species matters enormously here. A peptide with a 40-minute half-life in mouse plasma can behave very differently in human serum because of differences in circulating peptidase activity, so treat cross-species entries as directional, not interchangeable.
Beyond PEPlife2, three other sources round out a usable dataset:
- Supplementary data from published stability studies. Many peer-reviewed papers bury their raw stability curves in supplementary tables rather than the main text, so search for the compound name plus “supplementary” alongside the primary article.
- Institutional and pharma-sponsored repositories. Some university cores and consortiums publish batch stability data tied to specific assay validation projects, though access and formatting vary widely.
- Manufacturer certificates and technical dossiers. These rarely give full degradation curves but can confirm purity and lot-specific handling conditions that affect baseline stability.
Once you have candidate data pulled together, normalize before you compare anything. Half-life reported in minutes for a plasma assay is not directly comparable to a half-life reported in hours for a buffer-only stability test, and a value generated at 37°C means something different from one generated at room temperature.
| Filtering criterion | Why it matters | Practical action |
|---|---|---|
| Temperature | Degradation kinetics roughly double every 10°C rise | Group data by 4°C and 37°C before comparing |
| Matrix type | Plasma has active peptidases; buffer does not | Never pool buffer and plasma half-lives in one dataset |
| Labeling method | Isotopic and fluorescent tags can alter clearance | Flag labeled vs. unlabeled peptides separately |
| Concentration | High peptide concentration can saturate enzymes | Normalize to a common concentration range where possible |
Skipping this normalization step is the single most common reason two labs report wildly different half-lives for what looks like the same peptide.
What Actually Degrades a Peptide, and Which Sequences Are Most at Risk?
Two broad forces shorten peptide lifetime: enzymes cutting the backbone, and chemistry altering the side chains. Proteolytic cleavage tends to target specific bond types rather than attacking randomly. Trypsin-like enzymes cut after basic residues (lysine, arginine), chymotrypsin-like enzymes prefer bulky aromatics (phenylalanine, tyrosine, tryptophan), and aminopeptidases chew from the N-terminus inward, which is why N-terminal modification is often employed in stabilization work.
Chemical degradation runs on a separate clock. Methionine, tryptophan, and cysteine are the primary oxidation targets, especially under light exposure or in formulations with trace metal contamination. Asparagine and glutamine undergo deamidation, converting to aspartate or isoaspartate and often shifting biological activity even when the peptide mass barely changes on a spectrum. Aggregation adds a third failure mode entirely, driven less by sequence chemistry and more by concentration, agitation, and hydrophobic patch exposure during formulation stress.
Sequence composition predicts a meaningful chunk of this risk before you ever run an assay. A meta-analysis of peptide lifetimes under proteolytic conditions found that nonpolar residue content, tryptophan and tyrosine presence, and isoelectric point correlate with serum half-life, with a multivariable model reaching an R² of 0.392 for predicting proteolytic susceptibility.
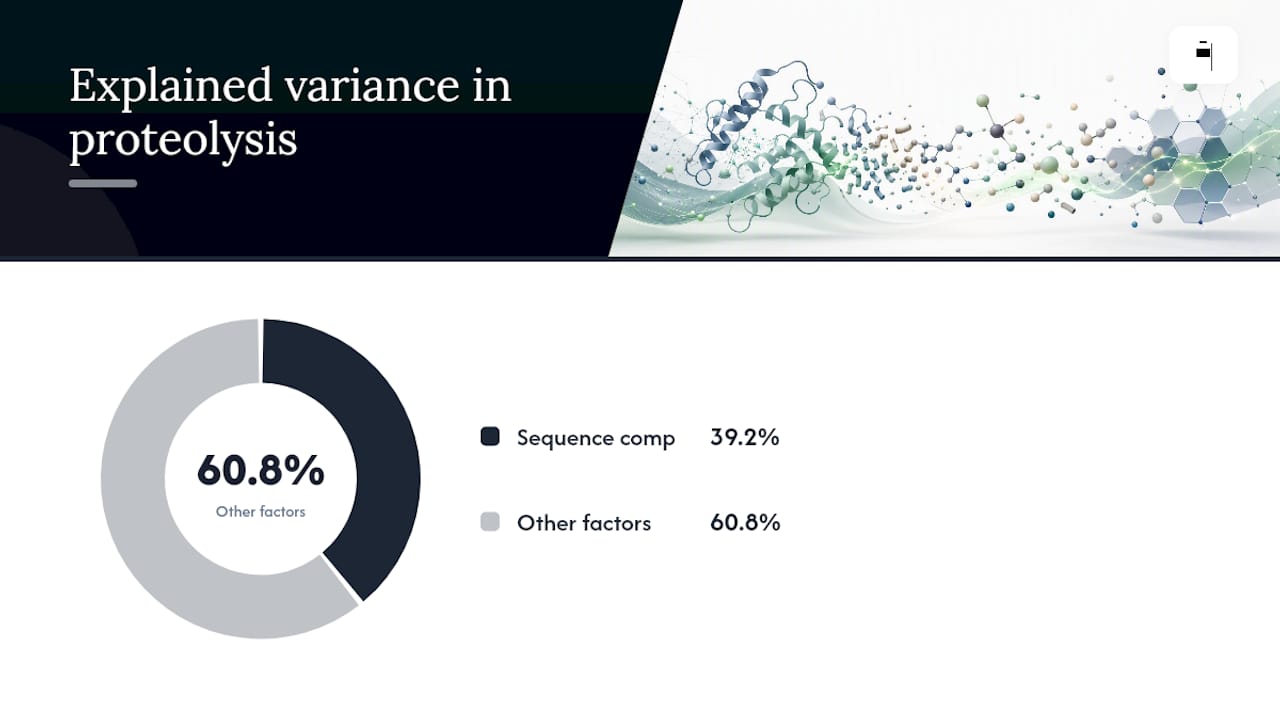
Peptide half-life prediction has real ceilings. An R² of 0.392 means sequence composition alone explains under 40% of the variance in proteolytic susceptibility. The rest comes down to formulation, matrix-specific enzyme activity, and structural features a simple composition model cannot capture.
Sequence features worth flagging during design review:
- High hydrophobic residue content, which correlates with faster proteolytic clearance in several serum studies.
- Tryptophan or tyrosine at exposed positions, both of which are proteolytic and oxidative hotspots.
- Isoelectric point far from physiological pH, which can affect solubility and indirectly influence aggregation risk.
- Unprotected N- and C-termini, the most common entry points for exopeptidase attack.
Physical state changes which mechanism dominates. Solution and lyophilized (solid) peptides degrade through different pathways: drying changes local water activity and effective pH at the microenvironment level, which can suppress hydrolysis while leaving oxidation largely unaffected. A peptide that looks rock-solid as a lyophilized powder can still degrade fast once reconstituted, so solid-state shelf life data should never substitute for solution-state validation.
How Do You Design a Peptide Stability Assay That Actually Works?
Start with the matrix that matches your end use, not the matrix that is easiest to source. Plasma stability assays answer questions about systemic exposure; serum assays strip out clotting factors and sometimes run cleaner on LC-MS/MS; cell supernatant assays tell you about local degradation in a culture system, which matters if you’re studying a peptide meant to act in situ rather than circulate.
A workable incubation protocol looks like this:
- Pre-warm the matrix to 37°C and confirm pH is within physiological range before spiking in peptide, since cold-start incubations skew early time points.
- Spike at a concentration you can quantify reliably across the full time course, typically in the low micromolar range for LC-MS/MS detection.
- Sample at graduated time points (commonly 0, 5, 15, 30, 60, 120, and 240 minutes for plasma work), front-loading the early points where degradation is fastest.
- Quench each aliquot immediately rather than letting it sit at room temperature, since ongoing enzymatic activity during processing will distort your apparent half-life.
- Process and analyze in a single batch where possible to avoid instrument drift confounding your kinetics.
Sample prep is where a lot of otherwise well-designed assays quietly fail. Strong acid precipitation, a common protein-crashing technique, can cause substantial peptide analyte loss because some peptides co-precipitate with plasma proteins or degrade under the acidic shock itself. Organic solvent mixtures, typically acetonitrile or methanol-based, preserve peptide recovery far more reliably and are now the preferred approach for LC-MS/MS-bound samples.
Labeling strategy is the other major fork in the road. Isotopic labeling (stable isotope-labeled internal standards) gives you the cleanest quantitation because the labeled and unlabeled peptide behave almost identically during extraction and ionization, correcting for matrix effects and recovery loss. Fluorescent labeling is faster and cheaper to implement but the label itself can alter peptide charge, hydrophobicity, and even enzymatic susceptibility, which means your stability data may reflect the labeled construct more than the native peptide.
Pro Tip: Run a no-peptide matrix blank alongside every stability time course. It catches background interference and confirms your quench step is actually stopping enzymatic activity rather than just diluting it.
Which Analytical Platform Gives You the Most Reliable Stability Data?
LC-MS/MS is the workhorse for quantitative peptide stability analysis, and for good reason: it separates the intact peptide from its degradation products before detection, which means you’re not guessing which mass peak corresponds to what species. MALDI-TOF is faster and requires less sample cleanup, making it useful for quick screening across many candidates, but it struggles with precise quantitation because ionization efficiency varies with matrix crystallization and co-eluting compounds are not chromatographically separated first.
Choose LC-MS/MS when you need defensible half-life numbers with confidence intervals. Choose MALDI-TOF when you’re triaging a large candidate pool and just need a rough stable versus unstable call before committing to deeper analysis.
Whichever platform you use, internal standards make or break your data quality:
- Stable isotope-labeled analogs correct for extraction recovery and ionization suppression, which is critical when plasma matrix effects vary batch to batch.
- Structurally related peptides can serve as a cheaper substitute standard, though they correct less precisely than a true isotopic match.
- Running a calibration curve alongside every batch (not just once per study) catches instrument drift that would otherwise masquerade as a stability signal.
Converting raw signal into a usable half-life takes a few defined steps. Calculate percent intact peptide at each time point relative to the time-zero signal, plot the natural log of percent intact against time, and fit a linear regression to extract the degradation rate constant. Half-life follows directly as ln(2) divided by that rate constant. Report the 95% confidence interval around your half-life estimate, not just the point value. This matters more than most researchers treat it: two studies reporting half-lives of 22 minutes and 31 minutes might be statistically indistinguishable if their confidence intervals overlap, and comparability across labs is worthless without those interval bounds.
Don’t discard the cleavage products either. Identifying where the peptide breaks (N-terminal truncation, internal cleavage, C-terminal loss) tells you which protease family is responsible and points directly at which sequence modification would extend half-life.
Can Predictive Models Replace Experimental Stability Testing?
Not yet, and probably not soon. Sequence-based predictive models have gotten genuinely useful for triage, but they are not a substitute for confirmatory assay data on your actual candidate.
Model classes range from simple composition-based regressions (the kind behind that R² of 0.392 for proteolytic susceptibility) to modern machine learning architectures trained on curated stability databases. The PepMSND model, published in 2025, reported an average accuracy of 0.867 and an AUC of 0.912 for predicting blood stability, trained on 635 experimental samples.
**A 635-sample training set is small by machine learning standards. An AUC of 0.912 looks strong, but with a dataset this size, performance can drop noticeably on peptide chemistries or modification types underrepresented in the training data. Treat published accuracy figures as a ceiling under favorable conditions, not a guarantee for your specific sequence class.
Before trusting any model’s output on a candidate peptide, run it through a validation checklist:
- Confirm the model’s training data included peptides with sequence features similar to yours (length, modification type, charge).
- Check whether the model’s reported performance came from an independent test set or from cross-validation on the same pool it trained on.
- Match assay conditions carefully. A model trained on human plasma stability data will not reliably predict cell supernatant or buffer stability.
- Where possible, validate predictions across more than one lab or assay run, since single-lab results can carry systematic bias from that lab’s specific protocol.
The practical workflow that gets the most out of both worlds: use a predictive model to rank and shortlist candidates, then confirm the top hits experimentally before investing further synthesis or formulation effort.
What Formulation Changes Actually Extend Peptide Shelf Life?
Buffer and pH selection is the cheapest lever you can pull, and it should be the first one you test. Targeting a pH range of roughly 5 to 6 is a common starting point because it tends to balance hydrolysis risk against deamidation risk, but no single buffer works universally. Peptides with different isoelectric points and side-chain compositions respond differently to the same buffer system, so this range is a starting hypothesis to test against your specific sequence, not a default to apply blindly.
Beyond pH, a handful of formulation tools show up repeatedly in stabilization work:
- Excipients like trehalose or sucrose can reduce aggregation during freeze-thaw cycles by acting as cryoprotectants.
- Viscosity modifiers slow molecular collision frequency in solution, which can meaningfully reduce aggregation-driven degradation in high-concentration formulations.
- Co-solvents such as low percentages of propylene glycol or glycerol can improve solubility for hydrophobic peptides while reducing surface-driven aggregation at container interfaces.
- Chelating agents like EDTA reduce metal-catalyzed oxidation, particularly relevant for methionine- and tryptophan-containing sequences.
For peptides where formulation tweaks alone can’t get you to a viable shelf life, chemical modification is the next tier. PEGylation adds bulk that can shield cleavage sites and slow renal clearance, though it often comes with reduced binding affinity that has to be weighed against the stability gain. Peptide stapling locks a helical conformation in place, which can dramatically improve proteolytic resistance for sequences that rely on that secondary structure for activity. Lipidation and fatty acid conjugation extend half-life primarily by promoting albumin binding, which shields the peptide from renal filtration and enzymatic attack; this is the mechanism behind several long-acting peptide therapeutics on the market today.
Pro Tip: Test formulation changes and sequence modifications separately before combining them. A PEGylated peptide in an untested buffer can mask whether your stability gain came from the modification or the formulation, wasting time when you try to troubleshoot later.
For projects where you need shelf-life estimates faster than real-time storage allows, accelerated stability testing fills the gap. Running peptides at elevated temperatures and applying Arrhenius extrapolation lets you estimate long-term shelf life from short-term stressed data. The catch is that this only works cleanly when the degradation pathway stays the same across temperatures. If oxidation dominates at 40°C but aggregation takes over at 4°C, your extrapolated shelf-life number will be wrong regardless of how clean the Arrhenius plot looks.
How Should Peptide Stability Data Be Reported for Reuse?
Cross-study comparability is a known weak spot in this field. Reviews of stability research point to inconsistent assay protocols and reporting formats as a primary barrier to comparing results across labs, which is exactly why so many published half-life values contradict each other for what looks like the same peptide.
A minimal reporting standard should include:
- Peptide sequence, including any modifications, N/C-terminal capping, or labeling.
- Assay matrix (species, plasma versus serum versus buffer) and exact temperature and pH.
- Peptide concentration and incubation time points, reported in consistent units (minutes or hours, µM).
- Half-life value with its 95% confidence interval, not a bare point estimate.
- Analytical method used (LC-MS/MS, MALDI-TOF) and internal standard type.
Practical habits that make your data actually reusable:
- Deposit raw time-course data alongside the calculated half-life, not just the summary number.
- Link stability data to the batch’s certificate of analysis so purity and identity are traceable.
- State explicitly whether the value describes solution-state or solid-state stability, since the two are not interchangeable.
Why Blank Peptides Backs Every Batch With Verifiable Data
Reliable stability data starts with a reliable starting material. If your peptide’s purity or identity is uncertain, every downstream half-life number inherits that uncertainty. Blank Peptides manufactures and finishes every product in USA facilities, with each batch independently lab-verified for greater than 99% purity and a certificate of analysis available on request.
For researchers running stability studies, that batch-level traceability matters:
- Every COA documents exact purity, giving you a defensible baseline before you start your degradation clock.
- USA manufacturing keeps supply chain variables (a common confound in cross-lab reproducibility) more consistent between orders.
- Rigorous quality control means the peptide you spike into your plasma assay today matches the one in your next reorder.
A base of researchers depend on that consistency for exactly this kind of work.
Why Standardized Stability Data Matters More Than Another Model
The field keeps investing in better predictive models while the underlying experimental data those models train on stays fragmented across incompatible protocols. That’s backwards. A model like PepMSND can only be as good as the 635 samples it learned from, and if half of those samples used inconsistent matrix conditions or unreported pH, the model inherits that noise silently.
Our position: cross-lab validation and standardized metadata should be treated as prerequisites for trusting any published half-life value, not optional extras. A half-life number without matrix, temperature, and confidence interval attached is not really usable data. It’s a rumor with a decimal point.
We’d like to see more labs deposit raw stability curves, not just summary statistics, into shared repositories like PEPlife2. If you’re generating stability data and want to compare notes on assay design or QC methodology, Blank Research Team is open to that conversation.
— Blank Research Team
Get Batch-Verified Peptides for Your Next Stability Study
Every stability assay is only as trustworthy as the peptide going into it. Blank Peptides supplies research-grade peptides at greater than 99% purity, manufactured and finished in USA facilities, with a certificate of analysis available for every batch so you can document your starting material before the degradation clock even starts.

That level of traceability matters whether you’re running a plasma incubation assay, building a formulation prototype, or generating training data for a predictive model. Researchers commonly use KISSPEPTIN and SEMAX as assay standards or stability study inputs, while products like GLUTATHIONE show up frequently in formulation and excipient testing work. Each product page lists purity data and COA availability, so you can review lot-specific documentation before ordering. If you need a QC record for a specific batch or want to check availability for an upcoming study, visit the Blank Peptides product catalog to place your order or request documentation directly.
Sources
For deeper reading beyond this guide, these resources cover the datasets, methods, and models referenced throughout:
- PEPlife2 peptide half‑life repository
- PepMSND peptide blood stability prediction (2025)
- Meta‑analysis of peptide lifetimes in proteolytic conditions
FAQ
How Long Can BPC-157 Stay Unrefrigerated?
Reconstituted peptides generally degrade faster at room temperature than when refrigerated, though exact stability windows depend on the specific formulation and buffer. Researchers should consult product-specific handling guidance and use their own stability assay data rather than assuming a fixed safe duration.
What Is the Shelf Life of a Peptide?
Shelf life depends heavily on physical state, formulation, and storage temperature. Lyophilized peptides typically remain stable far longer than reconstituted solutions, since drying changes the degradation pathways that dominate in solution, which is why solid-state and solution-state stability need separate validation.
Do Peptides Really Go Bad After 30 Days?
There’s no universal 30-day rule. Degradation rate depends on the specific sequence, storage temperature, buffer, and whether the peptide is lyophilized or reconstituted, so a peptide stable for months in one formulation might degrade within days in another.
How Do You Know When a Peptide Has Gone Bad?
The definitive method is analytical: LC-MS/MS or MALDI-TOF analysis showing a drop in percent intact peptide or the appearance of cleavage product peaks confirms degradation. Visual cues like cloudiness or discoloration can indicate aggregation but don’t reliably detect chemical degradation such as oxidation or deamidation.
Where Can I Get Peer-Reviewed Peptide Degradation Data?
PEPlife2 aggregates curated half-life data from the literature, and supplementary tables in published stability studies often contain raw degradation curves not shown in the main text.