6 Step Peptide Aliquoting Protocol for Reproducible Lab Storage
Aliquot any peptide you’ll draw from more than once, and skip it only for single-session, use-it-today vials. The upside is concrete: fewer freeze-thaw cycles, less contamination risk from repeated punctures, and results that actually replicate from week to week. If a vial has any chance of sitting in the freezer between uses, split it into single-use portions the day you reconstitute it.
TL;DR:
- Peptides containing reactive amino acids like cysteine, methionine, or tryptophan should always be aliquoted into single-use portions to prevent oxidation and aggregation.
- Storing reconstituted peptides at −20°C for short-term or below −70°C for long-term helps preserve stability, especially for sequences prone to degradation.
- Using sterile techniques, labeling before freezing, and fast freezing in pre-chilled racks significantly reduce contamination risk and cryoconcentration damage.
- Repeated freeze-thaw cycles and buffer solutions like saline accelerate peptide degradation, making aliquoting essential for maintaining sample integrity.
- Incorporating certificates of analysis and keeping detailed logs supports reproducibility and traceability, minimizing variability in peptide experiments.
Table of Contents
- Why Peptide Aliquoting Protects Sample Integrity
- Which Peptides Actually Need Aliquoting?
- How Do You Aliquot Peptides Step by Step?
- What Storage Temperature Keeps Peptides Stable?
- How Do You Label and Document Aliquots for Reproducibility?
- What Goes Wrong With Peptide Aliquoting?
- How Blank Research Team Thinks About Reproducibility
- Where to Get Vendor-Verified Peptides and Aliquoting Support
- Sources
- FAQ
Why Peptide Aliquoting Protects Sample Integrity
Every freeze-thaw cycle stresses a peptide chain in ways that add up fast. Ice crystal formation concentrates dissolved peptide into shrinking pockets of unfrozen liquid as a vial freezes, a phenomenon called cryoconcentration, and that crowding accelerates aggregation. Repeated thawing then compounds the problem by exposing the peptide to oxygen and temperature swings each time, which speeds up chemical breakdown at sensitive residues.
There’s a contamination angle too. Every needle puncture or pipette dip introduces a small chance of microbial or particulate contamination, and that risk multiplies with every draw from a shared vial. Manufacturer guidelines from Sigma-Aldrich specifically recommend aliquoting working stocks and avoiding repeated freeze-thaw cycles for exactly this reason.
Pro Tip: Solutions above pH 8 degrade faster in storage and should be frozen immediately if you’re not using them that day, according to peptide stability research. Most peptides do best at pH 5 to 6.
- Freeze-thaw cycling accelerates both aggregation and chemical degradation
- Cryoconcentration during freezing can locally shift pH and peptide concentration
- Each vial puncture adds contamination risk and increases batch-to-batch variability
Which Peptides Actually Need Aliquoting?
Not every vial demands the same caution, but a few flags should push you toward aliquoting without a second thought.
Check the sequence first. Peptides containing cysteine, methionine, or tryptophan oxidize more readily, and asparagine or glutamine residues are prone to deamidation over time. Hydrophobic stretches also raise aggregation risk during freeze-thaw, which makes single-use portions worth the extra prep time upfront.
Beyond sequence chemistry, look at how you’ll actually use the vial:
- Any project spanning multiple weeks or months, where the same stock gets drawn repeatedly
- Calibrators or internal standards used across multiple assay runs, where consistency matters more than convenience
- Large vials consumed slowly, where the ratio of draws to total volume is high
If a vial holds a month’s worth of doses and you’re drawing from it three times a week, that’s a textbook case for splitting it into single-use tubes at reconstitution.
How Do You Aliquot Peptides Step by Step?
Getting the volumes right at reconstitution saves you from awkward math later, and it starts before you even pull out a syringe.
- Calculate your reconstitution volume first. Decide how many doses or draws you need, then work backward. A 5mg vial reconstituted with 2mL of diluent yields 2.5mg/mL; if your planned dose is 0.25mg per aliquot, that’s 100 microliters per single-use tube, so plan your microtube count accordingly before you draw anything.
- Choose the right diluent. Bacteriostatic water is the standard choice for most research peptides, and targeting a final pH of 5 to 6 keeps the solution in its most stable range. Avoid reconstituting with buffered saline initially, since salts can hinder solubility for many sequences.
- Work aseptically. Swab vial stoppers before each puncture, use a fresh needle or tip for every transfer, and dispense directly into sterile single-use microtubes or syringes rather than a shared intermediate container.
- Label before you freeze, not after. Once tubes are capped, they all look identical. Write the peptide name, concentration, and date on each tube before it goes anywhere near the freezer.
- Freeze fast and freeze upright. Placing tubes in a pre-chilled metal rack or cryo-box speeds freezing and reduces cryoconcentration damage compared to setting them loose on a cold shelf.
- Never refreeze a thawed aliquot. Community protocols, including pre-filled syringe workflows documented by Ascend Peptide’s aliquoting guidance, treat each tube as strictly single-use. Thaw one, use it, discard what’s left.
Pro Tip: Batch your microtubes in a pre-chilled rack before you even open the peptide vial. The few minutes you save on freezing speed can be the difference between a stable aliquot and a slightly degraded one six weeks from now.
What Storage Temperature Keeps Peptides Stable?
Lyophilized peptide keeps best at −20°C for long-term storage, and some labs push to −80°C for maximum stability on sensitive sequences. Once reconstituted, the calculus changes. Recommendations for peptides used in mass spectrometry assays call for storing lyophilized material at −20°C or below and preparing enough frozen aliquots up front to avoid repeat freeze-thaw on calibrator stocks.
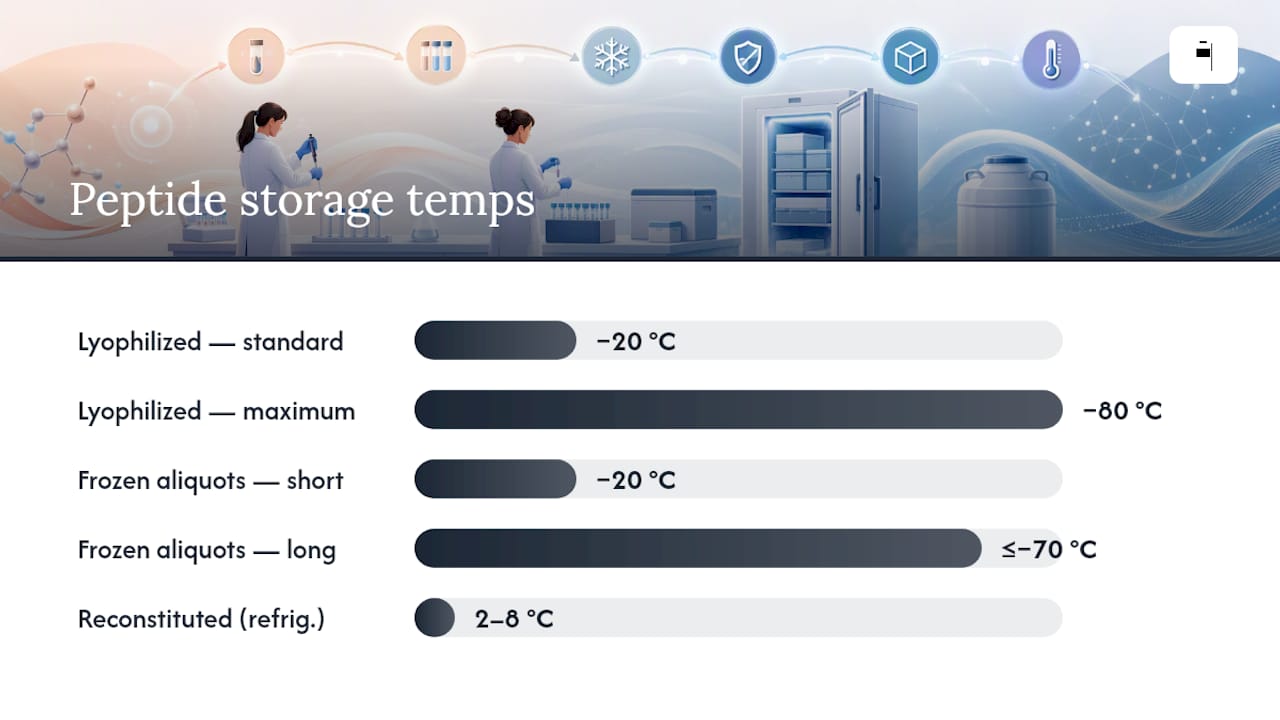
Frozen solution aliquots can tolerate −20°C for shorter stretches, but anything you need to hold for months benefits from −70°C or colder. Refrigerated reconstituted peptide, meanwhile, typically holds up for 21 to 30 days at 2 to 8°C, depending on the sequence.
One detail that trips people up: frost-free freezers cycle temperature slightly to prevent ice buildup, and that cycling behaves like a slow-motion freeze-thaw event on anything stored inside. Tucking your aliquot rack into a secondary insulated container blunts that effect.
- Lyophilized peptide: −20°C standard, −80°C for maximum stability
- Frozen reconstituted aliquots: −20°C short-term, ≤−70°C for long-term storage
- Refrigerated reconstituted peptide: usable roughly 21 to 30 days at 2 to 8°C
- Watch for cloudiness, particulates, or color shift as discard signals regardless of how long it’s been stored
How Do You Label and Document Aliquots for Reproducibility?
Good labeling turns a freezer box into a searchable record instead of a guessing game. Every tube should show the peptide name, the lot number tied to its certificate of analysis, the exact concentration, the reconstitution date, an expiry estimate, and the initials of whoever prepared it.
Behind the labels, keep a simple log. A freezer map showing which box holds which peptide, a running tally of aliquots used versus remaining, and a reference back to the vendor COA for that batch all make troubleshooting far easier when an assay result looks off six weeks later.
- Convert mg to mg/mL at reconstitution, then divide by your target dose to get aliquot volume
- Label fields: peptide name, lot/COA reference, concentration, reconstitution date, expiry, operator initials
- Maintain a freezer map and usage log tied back to each batch’s COA
- For high-volume or awkward vial sizes, ask your supplier about custom aliquoting or packaging before you order
What Goes Wrong With Peptide Aliquoting?
Most aliquoting failures trace back to a handful of repeat offenders. Slow freezing on an open shelf, reusing pipette tips between draws, working near a fume hood vent that warms samples mid-transfer, and reconstituting with buffered saline instead of a neutral diluent all show up again and again in troubleshooting logs.
Watch for warning signs: a drop in assay signal, unexplained carryover between samples, visible particulate in a thawed aliquot, or variability that creeps up run over run. For oxidation-prone sequences carrying cysteine, methionine, or tryptophan, storing under inert gas or in a desiccator, as GenScript’s handling guidance recommends, cuts down on slow chemical drift.
- Freeze faster using a pre-chilled rack instead of a cold shelf
- Pre-rinse pipette tips to reduce non-specific adsorption and carryover
- Use gravimetric checks on critical calibrators to catch mass errors early
- Store deliquescent or oxidation-prone sequences in a desiccator or under inert gas
Pro Tip: If assay variability creeps up over several weeks with no obvious cause, check your freezer type before you blame the peptide. A frost-free unit cycling temperature can quietly degrade samples that look perfectly stable on paper.
How Blank Research Team Thinks About Reproducibility

Peptide degradation rarely announces itself. That’s the real argument for aliquoting: it’s not about avoiding a dramatic failure, it’s about removing a variable you can’t see until your data stops replicating.
Blank Research Team emphasizes manufacturing and lab verification, with certificates of analysis available for batches, because reproducibility starts before the vial reaches your bench. Custom aliquoting and packaging requests are common enough that we treat them as a standard conversation, not a special favor, since the right format at the time of shipping saves a researcher from introducing risk at the reconstitution step.
— Blank Research Team
Where to Get Vendor-Verified Peptides and Aliquoting Support
Our company provides certificates of analysis on batches to support traceability starting before you open the vial, not after storage issues arise.
Our catalog covers research staples like Kisspeptin, Semax, and GLOW, alongside Hospira bacteriostatic water for reconstitution and diluent needs. In-house aliquoting still makes sense for most day-to-day lab work, since you control timing and volumes exactly to your protocol. Custom aliquoting and packaging requests can be discussed prior to ordering to accommodate specific project needs. Browse the full product catalog to see current formats and COA availability, and check a product page directly to start an order.
Sources
- PubMed article on peptide stability (34452224)
- Recommendations for peptides used in MS assays (PMC4830481)
- Peptide storage guide — Klarovel
FAQ
What Shouldn’t You Mix With Peptides During Reconstitution?
Avoid buffered saline solutions like PBS for initial reconstitution, since salts can hinder solubility for many sequences. Bacteriostatic water at a target pH of 5 to 6 is the standard, safer starting point.
What Does “Aliquoting” Mean in a Lab Context?
Aliquoting means dividing a larger sample, such as a reconstituted peptide vial or a blood sample, into smaller single-use portions so each draw or freeze-thaw event affects only one small volume instead of the entire stock.
How Many Times Should You Freeze and Thaw a Peptide Aliquot?
Ideally, once. Manufacturer and assay guidance both recommend treating each aliquot as single-use and avoiding repeated freeze-thaw cycles entirely, since each cycle accelerates aggregation and degradation.
How Long Do Reconstituted Peptide Aliquots Last in the Refrigerator?
Reconstituted peptide aliquots typically remain usable for about 21 to 30 days when stored at 2 to 8°C, though the exact window depends on the specific sequence and its stability profile.
Can Blankpeptides Prepare Custom Aliquots for My Project?
Yes, custom aliquoting and packaging requests can be arranged for bulk or long-term research orders. Reach out through the relevant product page to discuss format options before placing your order, as custom aliquoting services may be offered.
Researchers: Access Peptide Stability Data with PEPlife2 and COAs
Peptide stability data live primarily in curated repositories like PEPlife2, which covers 1,673 unique sequences with half-life values, assay conditions, and matrix details. Pull a dataset filtered to your matrix of interest (plasma, serum, or buffer), then cross-check candidate sequences with a predictive model such as PepMSND before committing bench time. The fastest validation path is a short plasma or serum incubation assay run against your top predicted hits, since public data rarely matches your exact formulation or lab conditions.
TL;DR:
- Species differences greatly impact peptide half-life, so cross-species data should be treated as directional rather than directly interchangeable for human applications.
- Peptides rich in hydrophobic residues, tryptophan, or tyrosine, especially at exposed positions, are more prone to proteolytic cleavage and oxidation.
- Stabilization is often achieved through pH adjustment, excipients, covalent modifications, or chemical alterations like PEGylation, with formulation changes needing separate validation.
- Standardized reporting of stability data—including assay conditions, confidence intervals, and raw data—is essential for reproducibility and model validation across laboratories.
Table of Contents
- Which Repositories Hold Usable Peptide Stability Data?
- What Actually Degrades a Peptide, and Which Sequences Are Most at Risk?
- How Do You Design a Peptide Stability Assay That Actually Works?
- Which Analytical Platform Gives You the Most Reliable Stability Data?
- Can Predictive Models Replace Experimental Stability Testing?
- What Formulation Changes Actually Extend Peptide Shelf Life?
- How Should Peptide Stability Data Be Reported for Reuse?
- Why Blank Peptides Backs Every Batch With Verifiable Data
- Why Standardized Stability Data Matters More Than Another Model
- Get Batch-Verified Peptides for Your Next Stability Study
- Sources
- FAQ
Which Repositories Hold Usable Peptide Stability Data?
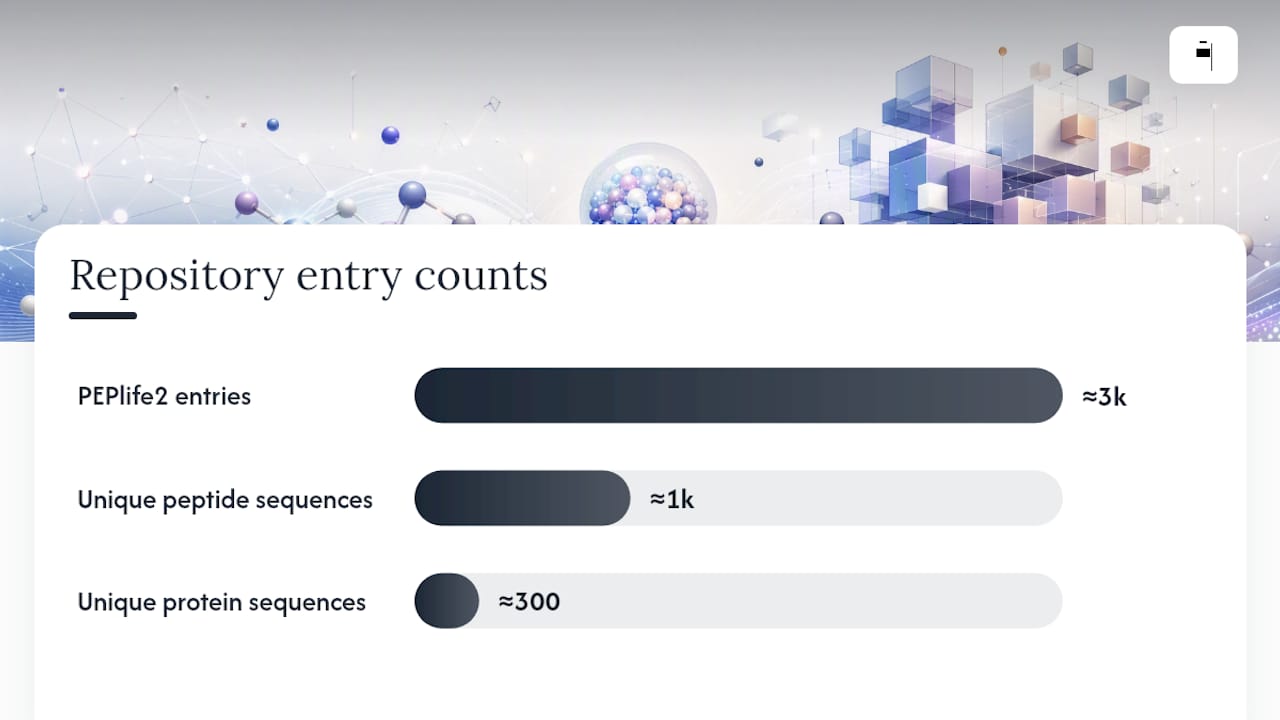
PEPlife2 is the closest thing the field has to a central clearinghouse. It holds roughly a few thousand entries spanning over a thousand unique peptide sequences and a few hundred unique protein sequences, each tagged with half-life values, assay matrix, and (where available) the enzymatic or chemical conditions under which degradation was measured. You can query it by sequence, by source protein, or by stability class, which makes it genuinely useful for building training sets or spot-checking a candidate before you order synthesis.
The catch is metadata completeness. Not every entry lists temperature, pH, or peptide concentration, and older entries pulled from legacy literature sometimes report half-life without specifying whether the matrix was human, rat, or mouse plasma. Species matters enormously here. A peptide with a 40-minute half-life in mouse plasma can behave very differently in human serum because of differences in circulating peptidase activity, so treat cross-species entries as directional, not interchangeable.
Beyond PEPlife2, three other sources round out a usable dataset:
- Supplementary data from published stability studies. Many peer-reviewed papers bury their raw stability curves in supplementary tables rather than the main text, so search for the compound name plus “supplementary” alongside the primary article.
- Institutional and pharma-sponsored repositories. Some university cores and consortiums publish batch stability data tied to specific assay validation projects, though access and formatting vary widely.
- Manufacturer certificates and technical dossiers. These rarely give full degradation curves but can confirm purity and lot-specific handling conditions that affect baseline stability.
Once you have candidate data pulled together, normalize before you compare anything. Half-life reported in minutes for a plasma assay is not directly comparable to a half-life reported in hours for a buffer-only stability test, and a value generated at 37°C means something different from one generated at room temperature.
| Filtering criterion | Why it matters | Practical action |
|---|---|---|
| Temperature | Degradation kinetics roughly double every 10°C rise | Group data by 4°C and 37°C before comparing |
| Matrix type | Plasma has active peptidases; buffer does not | Never pool buffer and plasma half-lives in one dataset |
| Labeling method | Isotopic and fluorescent tags can alter clearance | Flag labeled vs. unlabeled peptides separately |
| Concentration | High peptide concentration can saturate enzymes | Normalize to a common concentration range where possible |
Skipping this normalization step is the single most common reason two labs report wildly different half-lives for what looks like the same peptide.
What Actually Degrades a Peptide, and Which Sequences Are Most at Risk?
Two broad forces shorten peptide lifetime: enzymes cutting the backbone, and chemistry altering the side chains. Proteolytic cleavage tends to target specific bond types rather than attacking randomly. Trypsin-like enzymes cut after basic residues (lysine, arginine), chymotrypsin-like enzymes prefer bulky aromatics (phenylalanine, tyrosine, tryptophan), and aminopeptidases chew from the N-terminus inward, which is why N-terminal modification is often employed in stabilization work.
Chemical degradation runs on a separate clock. Methionine, tryptophan, and cysteine are the primary oxidation targets, especially under light exposure or in formulations with trace metal contamination. Asparagine and glutamine undergo deamidation, converting to aspartate or isoaspartate and often shifting biological activity even when the peptide mass barely changes on a spectrum. Aggregation adds a third failure mode entirely, driven less by sequence chemistry and more by concentration, agitation, and hydrophobic patch exposure during formulation stress.
Sequence composition predicts a meaningful chunk of this risk before you ever run an assay. A meta-analysis of peptide lifetimes under proteolytic conditions found that nonpolar residue content, tryptophan and tyrosine presence, and isoelectric point correlate with serum half-life, with a multivariable model reaching an R² of 0.392 for predicting proteolytic susceptibility.
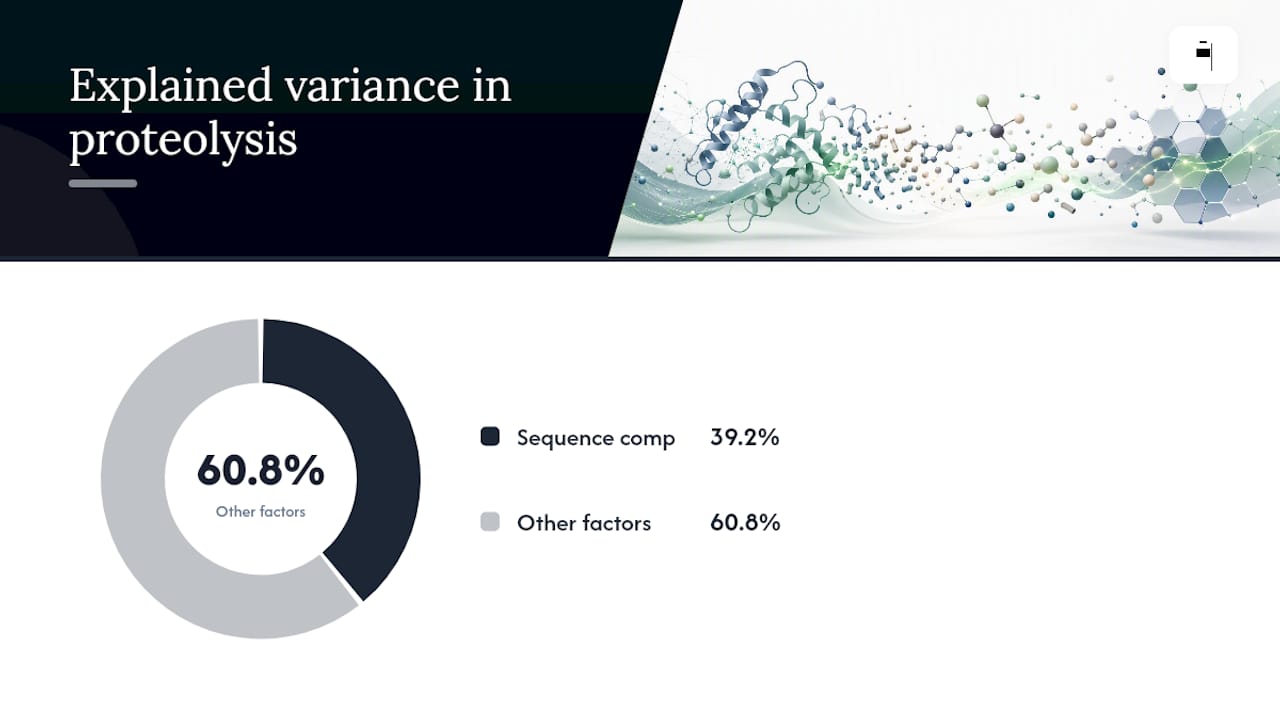
Peptide half-life prediction has real ceilings. An R² of 0.392 means sequence composition alone explains under 40% of the variance in proteolytic susceptibility. The rest comes down to formulation, matrix-specific enzyme activity, and structural features a simple composition model cannot capture.
Sequence features worth flagging during design review:
- High hydrophobic residue content, which correlates with faster proteolytic clearance in several serum studies.
- Tryptophan or tyrosine at exposed positions, both of which are proteolytic and oxidative hotspots.
- Isoelectric point far from physiological pH, which can affect solubility and indirectly influence aggregation risk.
- Unprotected N- and C-termini, the most common entry points for exopeptidase attack.
Physical state changes which mechanism dominates. Solution and lyophilized (solid) peptides degrade through different pathways: drying changes local water activity and effective pH at the microenvironment level, which can suppress hydrolysis while leaving oxidation largely unaffected. A peptide that looks rock-solid as a lyophilized powder can still degrade fast once reconstituted, so solid-state shelf life data should never substitute for solution-state validation.
How Do You Design a Peptide Stability Assay That Actually Works?
Start with the matrix that matches your end use, not the matrix that is easiest to source. Plasma stability assays answer questions about systemic exposure; serum assays strip out clotting factors and sometimes run cleaner on LC-MS/MS; cell supernatant assays tell you about local degradation in a culture system, which matters if you’re studying a peptide meant to act in situ rather than circulate.
A workable incubation protocol looks like this:
- Pre-warm the matrix to 37°C and confirm pH is within physiological range before spiking in peptide, since cold-start incubations skew early time points.
- Spike at a concentration you can quantify reliably across the full time course, typically in the low micromolar range for LC-MS/MS detection.
- Sample at graduated time points (commonly 0, 5, 15, 30, 60, 120, and 240 minutes for plasma work), front-loading the early points where degradation is fastest.
- Quench each aliquot immediately rather than letting it sit at room temperature, since ongoing enzymatic activity during processing will distort your apparent half-life.
- Process and analyze in a single batch where possible to avoid instrument drift confounding your kinetics.
Sample prep is where a lot of otherwise well-designed assays quietly fail. Strong acid precipitation, a common protein-crashing technique, can cause substantial peptide analyte loss because some peptides co-precipitate with plasma proteins or degrade under the acidic shock itself. Organic solvent mixtures, typically acetonitrile or methanol-based, preserve peptide recovery far more reliably and are now the preferred approach for LC-MS/MS-bound samples.
Labeling strategy is the other major fork in the road. Isotopic labeling (stable isotope-labeled internal standards) gives you the cleanest quantitation because the labeled and unlabeled peptide behave almost identically during extraction and ionization, correcting for matrix effects and recovery loss. Fluorescent labeling is faster and cheaper to implement but the label itself can alter peptide charge, hydrophobicity, and even enzymatic susceptibility, which means your stability data may reflect the labeled construct more than the native peptide.
Pro Tip: Run a no-peptide matrix blank alongside every stability time course. It catches background interference and confirms your quench step is actually stopping enzymatic activity rather than just diluting it.
Which Analytical Platform Gives You the Most Reliable Stability Data?
LC-MS/MS is the workhorse for quantitative peptide stability analysis, and for good reason: it separates the intact peptide from its degradation products before detection, which means you’re not guessing which mass peak corresponds to what species. MALDI-TOF is faster and requires less sample cleanup, making it useful for quick screening across many candidates, but it struggles with precise quantitation because ionization efficiency varies with matrix crystallization and co-eluting compounds are not chromatographically separated first.
Choose LC-MS/MS when you need defensible half-life numbers with confidence intervals. Choose MALDI-TOF when you’re triaging a large candidate pool and just need a rough stable versus unstable call before committing to deeper analysis.
Whichever platform you use, internal standards make or break your data quality:
- Stable isotope-labeled analogs correct for extraction recovery and ionization suppression, which is critical when plasma matrix effects vary batch to batch.
- Structurally related peptides can serve as a cheaper substitute standard, though they correct less precisely than a true isotopic match.
- Running a calibration curve alongside every batch (not just once per study) catches instrument drift that would otherwise masquerade as a stability signal.
Converting raw signal into a usable half-life takes a few defined steps. Calculate percent intact peptide at each time point relative to the time-zero signal, plot the natural log of percent intact against time, and fit a linear regression to extract the degradation rate constant. Half-life follows directly as ln(2) divided by that rate constant. Report the 95% confidence interval around your half-life estimate, not just the point value. This matters more than most researchers treat it: two studies reporting half-lives of 22 minutes and 31 minutes might be statistically indistinguishable if their confidence intervals overlap, and comparability across labs is worthless without those interval bounds.
Don’t discard the cleavage products either. Identifying where the peptide breaks (N-terminal truncation, internal cleavage, C-terminal loss) tells you which protease family is responsible and points directly at which sequence modification would extend half-life.
Can Predictive Models Replace Experimental Stability Testing?
Not yet, and probably not soon. Sequence-based predictive models have gotten genuinely useful for triage, but they are not a substitute for confirmatory assay data on your actual candidate.
Model classes range from simple composition-based regressions (the kind behind that R² of 0.392 for proteolytic susceptibility) to modern machine learning architectures trained on curated stability databases. The PepMSND model, published in 2025, reported an average accuracy of 0.867 and an AUC of 0.912 for predicting blood stability, trained on 635 experimental samples.
**A 635-sample training set is small by machine learning standards. An AUC of 0.912 looks strong, but with a dataset this size, performance can drop noticeably on peptide chemistries or modification types underrepresented in the training data. Treat published accuracy figures as a ceiling under favorable conditions, not a guarantee for your specific sequence class.
Before trusting any model’s output on a candidate peptide, run it through a validation checklist:
- Confirm the model’s training data included peptides with sequence features similar to yours (length, modification type, charge).
- Check whether the model’s reported performance came from an independent test set or from cross-validation on the same pool it trained on.
- Match assay conditions carefully. A model trained on human plasma stability data will not reliably predict cell supernatant or buffer stability.
- Where possible, validate predictions across more than one lab or assay run, since single-lab results can carry systematic bias from that lab’s specific protocol.
The practical workflow that gets the most out of both worlds: use a predictive model to rank and shortlist candidates, then confirm the top hits experimentally before investing further synthesis or formulation effort.
What Formulation Changes Actually Extend Peptide Shelf Life?
Buffer and pH selection is the cheapest lever you can pull, and it should be the first one you test. Targeting a pH range of roughly 5 to 6 is a common starting point because it tends to balance hydrolysis risk against deamidation risk, but no single buffer works universally. Peptides with different isoelectric points and side-chain compositions respond differently to the same buffer system, so this range is a starting hypothesis to test against your specific sequence, not a default to apply blindly.
Beyond pH, a handful of formulation tools show up repeatedly in stabilization work:
- Excipients like trehalose or sucrose can reduce aggregation during freeze-thaw cycles by acting as cryoprotectants.
- Viscosity modifiers slow molecular collision frequency in solution, which can meaningfully reduce aggregation-driven degradation in high-concentration formulations.
- Co-solvents such as low percentages of propylene glycol or glycerol can improve solubility for hydrophobic peptides while reducing surface-driven aggregation at container interfaces.
- Chelating agents like EDTA reduce metal-catalyzed oxidation, particularly relevant for methionine- and tryptophan-containing sequences.
For peptides where formulation tweaks alone can’t get you to a viable shelf life, chemical modification is the next tier. PEGylation adds bulk that can shield cleavage sites and slow renal clearance, though it often comes with reduced binding affinity that has to be weighed against the stability gain. Peptide stapling locks a helical conformation in place, which can dramatically improve proteolytic resistance for sequences that rely on that secondary structure for activity. Lipidation and fatty acid conjugation extend half-life primarily by promoting albumin binding, which shields the peptide from renal filtration and enzymatic attack; this is the mechanism behind several long-acting peptide therapeutics on the market today.
Pro Tip: Test formulation changes and sequence modifications separately before combining them. A PEGylated peptide in an untested buffer can mask whether your stability gain came from the modification or the formulation, wasting time when you try to troubleshoot later.
For projects where you need shelf-life estimates faster than real-time storage allows, accelerated stability testing fills the gap. Running peptides at elevated temperatures and applying Arrhenius extrapolation lets you estimate long-term shelf life from short-term stressed data. The catch is that this only works cleanly when the degradation pathway stays the same across temperatures. If oxidation dominates at 40°C but aggregation takes over at 4°C, your extrapolated shelf-life number will be wrong regardless of how clean the Arrhenius plot looks.
How Should Peptide Stability Data Be Reported for Reuse?
Cross-study comparability is a known weak spot in this field. Reviews of stability research point to inconsistent assay protocols and reporting formats as a primary barrier to comparing results across labs, which is exactly why so many published half-life values contradict each other for what looks like the same peptide.
A minimal reporting standard should include:
- Peptide sequence, including any modifications, N/C-terminal capping, or labeling.
- Assay matrix (species, plasma versus serum versus buffer) and exact temperature and pH.
- Peptide concentration and incubation time points, reported in consistent units (minutes or hours, µM).
- Half-life value with its 95% confidence interval, not a bare point estimate.
- Analytical method used (LC-MS/MS, MALDI-TOF) and internal standard type.
Practical habits that make your data actually reusable:
- Deposit raw time-course data alongside the calculated half-life, not just the summary number.
- Link stability data to the batch’s certificate of analysis so purity and identity are traceable.
- State explicitly whether the value describes solution-state or solid-state stability, since the two are not interchangeable.
Why Blank Peptides Backs Every Batch With Verifiable Data
Reliable stability data starts with a reliable starting material. If your peptide’s purity or identity is uncertain, every downstream half-life number inherits that uncertainty. Blank Peptides manufactures and finishes every product in USA facilities, with each batch independently lab-verified for greater than 99% purity and a certificate of analysis available on request.
For researchers running stability studies, that batch-level traceability matters:
- Every COA documents exact purity, giving you a defensible baseline before you start your degradation clock.
- USA manufacturing keeps supply chain variables (a common confound in cross-lab reproducibility) more consistent between orders.
- Rigorous quality control means the peptide you spike into your plasma assay today matches the one in your next reorder.
A base of researchers depend on that consistency for exactly this kind of work.
Why Standardized Stability Data Matters More Than Another Model
The field keeps investing in better predictive models while the underlying experimental data those models train on stays fragmented across incompatible protocols. That’s backwards. A model like PepMSND can only be as good as the 635 samples it learned from, and if half of those samples used inconsistent matrix conditions or unreported pH, the model inherits that noise silently.
Our position: cross-lab validation and standardized metadata should be treated as prerequisites for trusting any published half-life value, not optional extras. A half-life number without matrix, temperature, and confidence interval attached is not really usable data. It’s a rumor with a decimal point.
We’d like to see more labs deposit raw stability curves, not just summary statistics, into shared repositories like PEPlife2. If you’re generating stability data and want to compare notes on assay design or QC methodology, Blank Research Team is open to that conversation.
— Blank Research Team
Get Batch-Verified Peptides for Your Next Stability Study
Every stability assay is only as trustworthy as the peptide going into it. Blank Peptides supplies research-grade peptides at greater than 99% purity, manufactured and finished in USA facilities, with a certificate of analysis available for every batch so you can document your starting material before the degradation clock even starts.

That level of traceability matters whether you’re running a plasma incubation assay, building a formulation prototype, or generating training data for a predictive model. Researchers commonly use KISSPEPTIN and SEMAX as assay standards or stability study inputs, while products like GLUTATHIONE show up frequently in formulation and excipient testing work. Each product page lists purity data and COA availability, so you can review lot-specific documentation before ordering. If you need a QC record for a specific batch or want to check availability for an upcoming study, visit the Blank Peptides product catalog to place your order or request documentation directly.
Sources
For deeper reading beyond this guide, these resources cover the datasets, methods, and models referenced throughout:
- PEPlife2 peptide half‑life repository
- PepMSND peptide blood stability prediction (2025)
- Meta‑analysis of peptide lifetimes in proteolytic conditions
FAQ
How Long Can BPC-157 Stay Unrefrigerated?
Reconstituted peptides generally degrade faster at room temperature than when refrigerated, though exact stability windows depend on the specific formulation and buffer. Researchers should consult product-specific handling guidance and use their own stability assay data rather than assuming a fixed safe duration.
What Is the Shelf Life of a Peptide?
Shelf life depends heavily on physical state, formulation, and storage temperature. Lyophilized peptides typically remain stable far longer than reconstituted solutions, since drying changes the degradation pathways that dominate in solution, which is why solid-state and solution-state stability need separate validation.
Do Peptides Really Go Bad After 30 Days?
There’s no universal 30-day rule. Degradation rate depends on the specific sequence, storage temperature, buffer, and whether the peptide is lyophilized or reconstituted, so a peptide stable for months in one formulation might degrade within days in another.
How Do You Know When a Peptide Has Gone Bad?
The definitive method is analytical: LC-MS/MS or MALDI-TOF analysis showing a drop in percent intact peptide or the appearance of cleavage product peaks confirms degradation. Visual cues like cloudiness or discoloration can indicate aggregation but don’t reliably detect chemical degradation such as oxidation or deamidation.
Where Can I Get Peer-Reviewed Peptide Degradation Data?
PEPlife2 aggregates curated half-life data from the literature, and supplementary tables in published stability studies often contain raw degradation curves not shown in the main text.
Labs: Cut Translational Noise in Growth Hormone Analog Research
Growth hormone analog research today centers on long-acting somatropin modifications and novel GH receptor agonists that trade daily dosing for altered pharmacokinetics and new monitoring demands. The FDA has already cleared weekly formulations, and IGF-1 remains the anchor biomarker for dose titration across nearly every study design. Suppliers like Blankpeptides give labs a sourcing path for the research-grade materials these programs depend on. The practical fallout: shifted peak/trough profiles, IGF-1-informed dosing protocols, and trial endpoints built around annualized height velocity and lean body mass.
TL;DR:
- Long-acting GH analogs vary in mechanism, with GHRH analogs preserving pulsatility and fusion-based constructs altering receptor pharmacology, affecting assay design and tissue distribution.
- PEGylation shows slightly superior height gains compared to daily GH when adjusted for genetic height potential, but efficacy depends heavily on proper baseline correction.
- Biomarker panels in studies differ: pediatric trials focus on height and IGF-1 SDS, while adult studies include body composition, vascular, and redox markers for a fuller outcome picture.
- Dosing protocols should be driven by IGF-1 response and clinical tolerance, with short-term rechecks at four to eight weeks and careful monitoring of safety labs like glucose.
- Emerging antibody-based GH receptor agonists may extend half-life beyond current platforms, but species differences and the impact on pulsatility require cautious, well-designed translational research.
Table of Contents
- What Are the Main Classes of Growth Hormone Analogs?
- How Do Half-Life Extension Platforms Compare?
- What Clinical Endpoints Matter Most in GH Analog Trials?
- What Dosing and Monitoring Protocols Should Researchers Follow?
- What Emerging Technologies Are Shaping Future GH Research?
- Blank Research Team: Peptide Sourcing, Quality Controls, and Reproducible Research
- Where Should Growth Hormone Analog Research Go From Here?
- Sourcing Research-Grade Peptides for GH Analog Studies
- Sources
- FAQ
What Are the Main Classes of Growth Hormone Analogs?
Three mechanistic families dominate current growth hormone analog research, and the distinction between them shapes almost every downstream decision in assay design, dosing schedule, and safety monitoring.
GHRH analogs stimulate the pituitary to release the body’s own somatropin rather than delivering exogenous hormone directly. These compounds work upstream of the GH molecule itself, amplifying a physiological signal instead of replacing it. Because the resulting GH pulses still originate from the patient’s own pituitary, GHRH analogs tend to preserve more of the natural pulsatile secretion pattern that flatter, longer-acting formulations often lose.
Modified somatropin constructs take the opposite approach. Here, researchers chemically or genetically alter the somatropin molecule itself, either through permanent structural modification or through a cleavable carrier that releases the native hormone over time. That second category, exemplified by TransCon-style prodrug technology, matters enormously for interpretation: once the carrier detaches, what circulates is unmodified somatropin, meaning receptor pharmacology should closely resemble daily rhGH even though the dosing interval stretches to once weekly. Permanently modified somatropin, by contrast, may retain altered binding kinetics for its entire circulating life, which changes how a lab should read receptor occupancy data.
Direct GH receptor agonists and mimetics represent the newest and most structurally distinct class. Rather than modifying somatropin, these molecules, including antibody-derived formats, bind and activate the GH receptor through an entirely different molecular scaffold. That divergence from the native ligand shape means classic assays validated on somatropin may not transfer cleanly, and cross-reactivity testing becomes a real design consideration.
Why does this classification matter beyond taxonomy? Three practical reasons:
- Assay selection changes by class. Immunoassays calibrated against native somatropin may under or overestimate activity from a structurally divergent GHR agonist, so bioassays or receptor-binding assays often need re-validation for each new molecular scaffold.
- Tissue distribution differs by mechanism. A GHRH analog that stimulates endogenous pulses distributes differently over time than a fusion protein with a large hydrodynamic radius that stays confined largely to the vascular compartment.
- Clearance pathways diverge. Receptor-mediated clearance dominates for molecules that bind GH receptor directly, while renal filtration and carrier-mediated recycling matter more for large fusion constructs, a distinction that directly affects half-life modeling.
- Pulsatility preservation varies. GHRH analogs and short-acting formulations track closer to physiological pulse patterns, while long-acting agonists intentionally flatten exposure, a trade-off with consequences researchers are still characterizing for long-term receptor activation.
For a lab designing a new study, the first question is rarely “how potent is this molecule” but “which class does it belong to, and what does that imply about how I measure it.” A GHRH analog study needs pulsatility-sensitive sampling; a fusion-protein study needs steady-state PK modeling; a receptor-agonist study needs orthogonal confirmation that the assay actually detects the agonist’s unusual binding mode. Getting the classification wrong at the design stage tends to produce data that looks clean but answers the wrong question.
How Do Half-Life Extension Platforms Compare?
Half-life extension is where growth hormone analog research has made its most visible engineering progress, and five platforms currently dominate the literature: PEGylation, prodrug/carrier chemistry, Fc fusion, albumin fusion, and unstructured polypeptide fusion (XTEN-type technology).
PEGylation attaches polyethylene glycol chains to the somatropin molecule, increasing hydrodynamic size and slowing renal clearance. It is the most established of the five approaches, and real-world cohort data on PEG-rhGH in idiopathic short stature suggests it can produce marginally greater height SDS improvements than daily rhGH after adjusting for genetic height potential using mid-parental height SDS, according to a BMC Pediatrics cohort comparison. That adjustment matters. Without correcting for a child’s genetic growth ceiling, efficacy comparisons between platforms risk attributing a molecule’s baseline growth trajectory to the drug itself.
Prodrug and carrier-release chemistry, the mechanism behind TransCon-style constructs, attaches somatropin to an inert carrier that cleaves at a predictable rate, releasing native hormone into circulation. The appeal here is pharmacological cleanliness: because the released molecule is unmodified somatropin, receptor pharmacology should track daily dosing closely, just spread across a longer interval.
Fc fusion links GH to the fragment crystallizable region of an antibody, exploiting FcRn-mediated recycling to extend circulating time. This is also where some of the most granular mechanistic data in the field currently lives.
Albumin fusion and albumin-binding domains achieve a similar half-life extension effect by attaching GH to or near serum albumin, which has an intrinsically long circulating half-life and is recycled through the same FcRn pathway.
XTEN and related unstructured polypeptide fusions add a large, flexible, hydrophilic polypeptide chain to the GH molecule, increasing its apparent size and slowing clearance without relying on Fc or albumin biology at all.
Statistic callout: A 2025 mechanistic study of hGH-Fc fusion constructs found that design variables, including linker type, valency (monovalent versus bivalent), and fusion position, produced measurable inverse relationships between in vitro potency and in vivo exposure. Monovalent variants sometimes showed higher in vivo potency but also faster clearance, while removing or rigidifying a linker could raise systemic exposure (AUC) even as steric hindrance reduced in vitro receptor binding, according to PLOS One.
That inverse relationship is the central design tension in half-life extension work right now. A construct that looks superior in a cell-based potency assay can underperform in an animal PK study, and vice versa, which means no single assay tells the whole translational story.
Beyond the potency/exposure trade-off, three additional variables shape platform selection:
- Tissue access. Larger fusion constructs (Fc, albumin, XTEN) tend to stay confined more to plasma and highly perfused tissues, while smaller prodrug-released somatropin can distribute more like native hormone once it separates from its carrier.
- Receptor-mediated clearance. Constructs that bind GH receptor with high affinity get cleared faster through receptor internalization, an effect that platform engineers actively try to tune through linker and fusion-position changes.
- Peak/trough flattening. Extended half-life inherently smooths the peak-to-trough ratio, which reduces injection frequency but also departs further from the pulsatile GH secretion pattern the body produces naturally, a concern flagged repeatedly in pulsatility-focused reviews.
- Injection-site volume. Larger fusion molecules sometimes require higher injection volumes or more viscous formulations, a formulation-stage constraint that rarely appears in efficacy papers but matters for real-world tolerability studies.
No platform wins outright across every axis. Researchers designing comparative studies typically need to specify which trade-off they’re prioritizing, exposure duration, tissue distribution fidelity, or pulsatility preservation, before selecting which class of long-acting construct to test.
What Clinical Endpoints Matter Most in GH Analog Trials?
Annualized height velocity remains the primary efficacy endpoint in pediatric growth hormone deficiency trials, but a single 52-week randomized phase 3 trial illustrates how much nuance sits underneath that one number. The briGHt trial, testing a once-weekly prodrug that releases unmodified somatropin, reported noninferiority and statistical superiority on annualized height velocity compared with daily somatropin, with a comparable safety profile, according to the phase 3 trial results. That outcome supports the mechanistic argument made earlier: when a long-acting platform releases native, unmodified hormone rather than a permanently altered molecule, efficacy and safety can track daily dosing closely despite the extended interval.
Beyond height velocity, current trials and observational studies typically track a cluster of secondary endpoints:
- IGF-1 SDS (standard deviation score) as the primary biochemical marker of biological response and a proxy for dose adequacy.
- Lean body mass and trunk fat percentage, particularly in adult GH deficiency studies where body composition change often matters more clinically than linear growth.
- Bone mineral density, especially in longer interventional studies where skeletal effects accumulate over months to years.
- Standard safety labs and glucose metabolism markers, tracking the known class-wide risk of altered insulin sensitivity.
IGF-1 monitoring deserves its own discussion because interpretation is rarely as simple as comparing a single value to a normal range. IGF-1 concentrations shift meaningfully with age, sex, and estrogen status. Oral estrogen, for instance, suppresses hepatic IGF-1 production through first-pass metabolism, meaning a female patient on oral contraceptives or hormone therapy can show a lower IGF-1 reading despite adequate GH exposure, a confound that transdermal estrogen largely avoids. Researchers designing or interpreting IGF-1 data need to control for or at minimum document these variables, or risk misclassifying dose adequacy.
An interventional study of adult GH replacement found that beyond IGF-1 normalization, redox and vascular biomarkers shifted meaningfully: oxidized LDL (Ox-LDL) decreased, while thioredoxin (Trx) and 8-oxoguanine DNA glycosylase (OGG1) both increased, alongside gains in lean body mass and bone mineral density. The findings suggest that IGF-1 alone may understate the biological effect of sustained GH replacement over longer treatment windows.
That study, published in MDPI’s redox biomarker research, points toward a broader shift in how researchers think about outcome measurement. Ox-LDL, Trx, and OGG1 are not yet standard trial endpoints, but they represent a research direction worth tracking: cardiovascular and oxidative-stress biomarkers as clinically meaningful outcomes in their own right, not just downstream curiosities attached to IGF-1 normalization.
The practical takeaway for anyone designing a comparative study is straightforward. Match your endpoint panel to your treatment duration and population. Short pediatric trials lean on annualized height velocity and IGF-1 SDS almost exclusively. Longer adult studies increasingly benefit from adding body composition and, where feasible, exploratory redox or vascular markers that capture effects a single hormone assay would miss entirely.
What Dosing and Monitoring Protocols Should Researchers Follow?
Dose initiation for growth hormone analogs should be guided by IGF-1 response and clinical tolerance rather than a fixed weight-based formula applied uniformly across platforms, since half-life extension technology changes how quickly a given dose reaches steady-state exposure.
A workable titration framework for research and clinical protocols typically follows this sequence:
- Establish a baseline IGF-1 SDS before initiating any GH analog, accounting for the patient’s age, sex, and, where relevant, estrogen status.
- Start at a conservative dose appropriate to the platform’s half-life. Long-acting weekly formulations generally start lower than their daily-dose equivalent would suggest, since accumulation over the dosing interval can otherwise push exposure too high.
- Recheck IGF-1 at a defined interval, typically four to eight weeks after initiation or any dose change, timed consistently relative to the last dose to avoid conflating timing artifacts with true response.
- Titrate based on IGF-1 SDS and clinical response together, not IGF-1 alone. Two patients with identical IGF-1 SDS scores can have meaningfully different growth velocity or body composition trajectories.
- Reassess safety labs at scheduled intervals, including fasting glucose and HbA1c, given the class-wide association between GH exposure and reduced insulin sensitivity.
Adverse events worth monitoring differ somewhat by platform. Injection-site reactions, including lipoatrophy and localized swelling, appear across nearly all subcutaneous GH analogs but can be more pronounced with higher-volume or more viscous long-acting formulations. Fluid retention, arthralgia, and headache cluster more heavily during dose initiation and typically attenuate over the first weeks of treatment. Glucose metabolism changes require longer-term surveillance, since insulin sensitivity shifts can take months to manifest clearly in lab values.
For research protocols specifically, sample timing discipline is what separates a clean PK/PD dataset from a noisy one. Blood draws for pharmacokinetic sampling should follow a pre-specified schedule relative to dosing, capturing both peak and trough concentrations where the study design allows. IGF-1 sampling windows should stay consistent across visits and, ideally, across subjects, to avoid introducing variance that has nothing to do with the drug being studied. Long-term safety surveillance, particularly for glucose metabolism and any signal related to malignancy risk in extended-duration studies, benefits from pre-registered follow-up intervals rather than ad hoc rechecking.
Pro Tip: When comparing a new long-acting construct against daily somatropin in a research protocol, build dose-equivalence calculations and IGF-1 sampling windows into the study design before enrollment begins. Retrofitting these controls after data collection almost always introduces bias that’s difficult to correct statistically, a lesson borne out in how the briGHt trial structured its comparative dosing methodology.
What Emerging Technologies Are Shaping Future GH Research?
Antibody-derived GH receptor agonists represent the most structurally novel direction in growth hormone analog research right now, and early preclinical data suggests they could push half-life extension well beyond what current fusion platforms achieve.
VHH-based constructs, single-domain antibody fragments derived from camelid heavy-chain-only antibodies, offer a distinct design advantage: pH-dependent receptor binding. Engineering a molecule to bind its target tightly at physiological pH but release more readily in the acidic environment of the endosome can reduce target-mediated drug disposition (TMDD), a clearance mechanism where the drug’s own receptor binding drives its elimination. One preclinical study of a pH-responsive VHH-based GH mimetic reported sustained effect for more than 15 days in rat models, a duration that would represent a substantial leap beyond current weekly formulations if it translates to humans, according to Tandfonline’s VHH mimetic research.
That “if it translates” qualifier carries real weight. Several translational gaps stand between promising rodent data and viable human dosing:
- Species differences in FcRn binding mean a molecule engineered for optimal recycling in rodent models may behave differently in human FcRn, requiring re-optimization rather than direct dose scaling.
- TMDD magnitude varies by receptor density and turnover, which differs across species and even across tissue types within the same species, complicating straightforward allometric scaling.
- Pulsatility modeling remains underdeveloped for ultra-long-acting constructs. If a molecule maintains detectable receptor activation for two or more weeks, researchers need PK/PD models that account for whatever biological cost, if any, comes from abandoning pulsatile signaling entirely.
- Human dose prediction from animal PK/PD data requires more than simple exposure matching; receptor occupancy duration and downstream signaling kinetics both need translation, not just circulating concentration.
Given those gaps, the field’s near-term research priorities look fairly clear. Comparative PK/PD studies that directly benchmark new constructs against existing long-acting platforms, using matched dosing and sampling protocols, would do more to advance the field than another isolated preclinical potency study. Tissue-distribution assays that go beyond plasma sampling, tracking where these larger or structurally unusual molecules actually accumulate, would clarify whether antibody-based agonists behave more like small-molecule mimetics or more like traditional biologics. And standardized biomarker panels, incorporating not just IGF-1 but the redox and vascular markers gaining traction in longer human studies, would let researchers compare across platforms and across labs without each study inventing its own outcome measures from scratch.
The honest summary: the mechanistic ingenuity in this space has outpaced the translational infrastructure needed to evaluate it consistently. That gap is exactly where the next wave of methodologically rigorous research needs to focus.

Blank Research Team: Peptide Sourcing, Quality Controls, and Reproducible Research
Reproducibility problems in growth hormone analog research rarely trace back to a flawed hypothesis. They trace back to material variability that nobody controlled for at the sourcing stage.
Blankpeptides manufactures and finishes its research peptides in cGMP and FDA-registered facilities located in the United States, with every batch independently lab-verified for purity above 99% and a certificate of analysis available on request. For a lab running comparative PK/PD work, batch-to-batch consistency isn’t a convenience. It’s a prerequisite. A GHRH analog or GHR agonist construct that varies even slightly in purity between batches can introduce noise into exactly the kind of linker, valency, and fusion-position comparisons discussed earlier in this article, making it difficult to tell whether an observed PK/PD shift reflects the biology under study or a sourcing inconsistency that has nothing to do with the experiment.
Independent verification matters here specifically because self-reported purity claims are common across the peptide supply industry and difficult for individual labs to audit on their own. A third-party COA tied to each specific batch gives researchers a documentation trail they can cite in methods sections and reference during peer review, without needing to run redundant purity testing in-house before every experiment.
Many researchers rely on consistent, well-documented materials for exactly this kind of work. Additional credentialing details, laboratory partnerships, and specific batch-testing case studies may be available directly through some suppliers for researchers who need documentation beyond the standard COA for institutional or regulatory purposes.
Where Should Growth Hormone Analog Research Go From Here?
The single biggest limitation in this field isn’t a lack of clever molecules. It’s a lack of shared reporting standards. Every research group seems to define its own linker nomenclature, its own IGF-1 sampling windows, its own biomarker panel, which makes cross-study comparison far harder than it should be for a field this mature. A standardized minimum reporting set, covering fusion position, valency, linker chemistry, and a common biomarker core including IGF-1 SDS plus at least one body composition measure, would let researchers actually stack findings across labs instead of re-litigating basic comparisons every time a new construct enters the literature.
Preclinical-to-clinical PK/PD modeling needs more transparency too. The inverse potency-exposure relationships showing up in fusion protein research aren’t a reason to distrust the platform technology; they’re a reason to publish the full dataset, including the constructs that underperformed, rather than only the lead candidate that made it to the next phase. Negative and mixed results in this space carry real translational value.
On the ethical side, the pull toward ultra-long-acting constructs deserves a harder look before human trials scale up. A molecule that maintains receptor activation for two weeks or more departs meaningfully from physiological pulsatility, and researchers should treat that departure as a hypothesis requiring evidence, not an assumption that longer automatically means better. Human translational trials for these novel modalities should build in monitoring specifically designed to catch the biological cost of that departure, not just the convenience benefit of fewer injections.
— Blank Research Team
Sourcing Research-Grade Peptides for GH Analog Studies
If your work touches the GH axis, three products in the Blankpeptides catalog come up often in pituitary and metabolic research protocols. AOD-9604 is a modified fragment of the somatropin molecule studied in metabolic and GH-axis research contexts.

CJC-1295 / IPAMORELIN pairs a GHRH analog with a GHRP-class secretagogue, a combination frequently used in preclinical pituitary-axis studies and PK/PD assay work. GLOW rounds out the catalog as a marketed research compound available for qualified labs building out broader research protocols.
Every product ships with a batch-specific certificate of analysis and purity independently verified above 99%, manufactured and finished in cGMP, FDA-registered US facilities. Ordering is restricted to research use only, for qualified researchers aged 21 and older; casual or personal-use inquiries aren’t part of what Blankpeptides serves. If your institution needs batch-specific COA data beyond what’s posted, reach out through the product page for the specific compound and request documentation before your order ships. Visit the AOD-9604 product page to review current specifications and place a research order.
Sources
The clinical and mechanistic claims in this article draw on a small set of primary sources worth reading in full for anyone designing a comparative study.
The PLOS One fusion-protein engineering study substantiates the linker, valency, and fusion-position trade-offs discussed in the half-life extension section. The briGHt phase 3 trial provides the clinical efficacy and safety evidence behind prodrug-based weekly somatropin dosing. The MDPI redox biomarker study supports the exploratory biomarker discussion in the endpoints section. The Frontiers in Endocrinology review underpins the pulsatility and monitoring concerns raised throughout. The BMC Pediatrics cohort study informs the real-world efficacy comparison between PEG-rhGH and daily rhGH. The FDA’s regulatory notice grounds the regulatory landscape referenced across the article.
This article is general information, not a substitute for advice from a qualified doctor. Consult a qualified healthcare professional about your own circumstances before acting on anything here.
- Engineering of long-acting human growth hormone-Fc fusion proteins: Effects of valency, fusion position, and linker design on pharmacokinetics and efficacy (PLOS One, 2025)
- Once-weekly prodrug releasing somatropin: phase 3 briGHt trial results (2026)
- Twenty-four-month rhGH intervention: effects on redox regulation, vascular biomarkers, and body composition (MDPI, 2026)
- Frontiers in Endocrinology — review discussing pulsatility concerns and LAGH monitoring (2021)
FAQ
What are some examples of growth hormone analogs?
Current examples span GHRH analogs, prodrug-based weekly somatropin formulations, Fc and albumin fusion constructs, PEGylated somatropin, and emerging antibody-derived GH receptor agonists like VHH-based mimetics.
What age is too late for hGH therapy in research or clinical contexts?
There’s no fixed upper age cutoff; eligibility depends on the diagnostic indication, epiphyseal growth plate status for height-related pediatric use, and confirmed GH deficiency for adult applications, so age thresholds vary by protocol and regulatory approval rather than a single universal rule.
What is the best alternative to hGH for research purposes?
There’s no single best alternative since GHRH analogs, GH receptor agonists, and modified somatropin constructs each serve different mechanistic research questions; the right choice depends on whether a study needs preserved pulsatility, extended half-life, or direct receptor activation.
Is hGH safer than testosterone for research and therapeutic use?
The two hormones carry different risk profiles and aren’t directly comparable; GH therapy research focuses on glucose metabolism and IGF-1-related monitoring, while testosterone research centers on distinct cardiovascular and hematologic safety endpoints, so safety comparisons depend entirely on the specific research question and population.
Hit 80% Supplier Satisfaction with COA Backed Guarantees for Procurement
A supplier satisfaction guarantee is a contractual promise that ties measurable acceptance criteria, like purity thresholds or delivery windows, to specific remedies such as repair, replacement, or refund. It works best on high-value or mission-critical purchases and new supplier relationships, where verifiable documentation like a certificate of analysis (COA) and a clear RMA process turn a vague promise into something a buyer can actually enforce.
TL;DR:
- Guarantees should specify measurable criteria, such as a specific purity percentage verified by independent lab analysis, to be enforceable.
- Remedy hierarchies must include clear timelines for repair, replacement, or refund processes, with documented evidence requirements like COA comparisons.
- Suppliers should provide accessible, third-party verified COAs for each batch before order placement to prevent disputes and ensure transparency.
- Maintaining vendor satisfaction scores above 80% and tracking key KPIs like on-time delivery and claim resolution times helps assess guarantee effectiveness.
- A well-structured guarantee can reduce procurement friction and foster trust when contracts tie remedies to objective, verifiable standards rather than vague promises.
Table of Contents
- Common Types of Supplier Satisfaction Guarantees (With Real Examples)
- What the Guarantee Actually Covers, and What It Doesn’t
- The Business Case for Offering a Guarantee, and the Risk You’re Accepting
- How to Write a Supplier Satisfaction Guarantee That Actually Holds Up
- Measuring Whether the Guarantee Is Actually Working
- How Blank Peptides Puts a Satisfaction Guarantee Into Practice
- What Happens When a Guarantee Is Missing (and When It Works)
- Author Perspective: Where Guarantees Actually Break Down
- Request a COA Before Your Next Order
- Sources
- FAQ
Common Types of Supplier Satisfaction Guarantees (With Real Examples)
Most supplier guarantees fall into a handful of structures, and the right one depends on what’s actually being purchased. A commodity part needs different protection than a custom-manufactured compound with a six-month lead time.
Money-back or refund guarantees are the simplest version: if the product fails a defined test within a set window, usually 15 to 30 days, the buyer gets a full or partial refund. These work well for standardized goods but get risky fast when applied broadly to complex or perishable materials without tight conditions attached.
Performance or SLA-linked guarantees tie the remedy to a measurable metric instead of general dissatisfaction. A supplier might guarantee 98% on-time delivery or a purity threshold above 99%, with credits or replacement stock triggered automatically when the metric is missed. This structure protects both sides because the trigger is objective, not a subjective “I’m not happy” claim.
Trial, sample, or acceptance-period guarantees let buyers test a small batch before committing to a full order. A 30-day acceptance window with defined testing protocols gives the buyer time to run lab verification without holding the supplier hostage to unlimited return rights.
Lifetime or replacement guarantees suit components with long service lives, industrial fasteners, sensors, or anything where failure years down the line still traces back to a manufacturing defect. These carry more financial exposure and usually need a serial-number or lot-tracking system to stay enforceable.
Branded “happiness” pledges, common in consumer retail, get adapted for B2B by pairing the emotional promise with hard documentation. Instead of “we guarantee you’ll love it,” a business version reads more like: “We guarantee every batch meets stated purity specifications, verified by independent lab testing, or we replace it at no cost.”
The strongest programs usually combine two of these. A performance guarantee handles the day-to-day metrics, while a trial period covers the onboarding of a brand-new supplier relationship. Marketing-facing guarantee templates can help with plain language, but B2B versions need harder edges: specific test methods, specific timelines, specific evidence requirements.
- Refund or money-back guarantee tied to a testing window
- Performance/SLA guarantee tied to a delivery or quality metric
- Trial or acceptance-period guarantee for new suppliers
- Lifetime or extended replacement guarantee for critical components
- Branded pledge backed by documentation rather than sentiment
What the Guarantee Actually Covers, and What It Doesn’t
A guarantee that promises everything protects no one. The scope needs to name exactly what’s covered, what remedy applies, and what voids the claim entirely.
Scope should specify:
- Product specifications and tolerances (purity percentage, concentration, dimensional limits)
- Documentation requirements, including a COA for every batch or lot
- Delivery timing and packaging condition on arrival
- Support and technical response commitments
Remedies should follow a hierarchy, not a blank check. Repair or correction comes first when feasible, replacement comes second, and credit or refund comes last, reserved for cases where the first two aren’t practical. Each step needs its own timeline, for example, acknowledgment within 24 hours and a replacement shipment within 5 business days.
Exclusions matter as much as coverage. Buyer misuse, improper storage, third-party integration failures, and claims filed after the acceptance window closes should all be written out explicitly. Vague exclusion language is where most disputes start.
RMA requirements should specify the evidence a claim needs: photos of the product, a COA comparison against the original batch documentation, and independent lab results where purity or potency is disputed.
The Business Case for Offering a Guarantee, and the Risk You’re Accepting
A guarantee is a negotiation tool before it’s a service promise. Buyers move faster through procurement when the downside risk of a bad batch is already spelled out in the contract, which shortens the sales cycle and reduces the back-and-forth over indemnification language.
The upside shows up in retention. Research on supplier relationships finds that trust, contractual justice, and reliable payment terms predict supplier satisfaction, and that satisfaction in turn drives stronger supplier performance. A guarantee is one of the clearest ways to signal contractual justice: you’re putting a specific remedy in writing instead of asking the buyer to trust your intentions.
A guarantee only works if the underlying claim it makes is honest. Broken promises around support and delivery are among the most common causes of vendor dissatisfaction, which means an overpromised guarantee does more damage than none at all.
The risk side is real, though. Broad refund policies expose suppliers to false claims, and a satisfaction guarantee written without acceptance criteria becomes an argument generator rather than a trust builder. Weigh these before drafting:
- Exposure to returns on products that were used or stored incorrectly
- Administrative cost of processing and verifying every claim
- Regulatory limits on refunds or replacements in certain product categories
- Margin compression if remedy timelines require expedited shipping
A guarantee makes sense for critical parts, first-time suppliers, and high-dollar contracts. For low-stakes, low-margin commodity orders, tighter acceptance criteria upfront usually protects both sides better than a broad refund promise after the fact.
How to Write a Supplier Satisfaction Guarantee That Actually Holds Up
Most guarantees fail not because the intent was bad, but because the clause was written too loosely to enforce. Follow this sequence and you end up with contract language legal can actually sign off on.
- Define measurable acceptance criteria first. Tie every promise to something checkable: a COA threshold, a spec sheet tolerance, or a specific lab test method. “Satisfactory quality” is not a standard; “≥99% purity confirmed by third-party HPLC analysis” is.
- Set a remedy hierarchy with real timelines. Decide upfront whether repair, replacement, or refund comes first, and attach a business-day deadline to each stage of the response.
- Draft the RMA workflow before you need it. List exactly what evidence a buyer submits, who reviews it, and how fast a decision gets communicated.
- Write your exclusions in plain language. Buyer mishandling, storage outside specified conditions, and use outside stated parameters should all be named, not implied.
- Add audit and testing rights. Let the buyer request independent verification of a disputed batch, which protects your credibility more than it exposes your process.
- Route the draft through procurement, quality, legal, and sales before it ships. A guarantee written by one department and never checked by the others is where most enforcement problems start.
Pro Tip: Write the exclusion list before you write the coverage list. It’s easier to spot gaps in what you’re promising when you already know what you refuse to cover.
Measuring Whether the Guarantee Is Actually Working
A guarantee without a measurement system is just a promise you hope nobody tests. The KPIs worth tracking are the ones that show up before a formal complaint does.
Track vendor satisfaction score, on-time delivery rate, first-pass yield, RMAs per 1,000 units shipped, and average claim resolution time. Each one flags a different kind of failure, quality issues show up in first-pass yield, communication issues show up in resolution time.
A supplier scorecard weights these categories, typically quality, delivery, responsiveness, and compliance, into a single composite score. Industry KPI guidance suggests aiming for vendor satisfaction scores above 80%, with scores in the 60% to 79% range signaling room for improvement and anything under 60% requiring urgent corrective action. Some manufacturers apply the same 80% threshold at the category level, triggering a formal corrective action plan whenever a supplier’s quality or delivery rating drops below it.
| Category | What It Measures | Corrective Trigger |
|---|---|---|
| Quality | First-pass yield, COA accuracy | Below 80% |
| Delivery | On-time shipment rate | Below 80% |
| Responsiveness | Claim resolution time | Missed SLA |
| Compliance | Documentation completeness | Any gap |
Guarantee outcomes should feed directly into quarterly supplier reviews. A supplier that consistently triggers remedy claims needs a corrective action plan before contract renewal, not after a third failure.
How Blank Peptides Puts a Satisfaction Guarantee Into Practice
Blankpeptides builds its guarantee around the same controls this playbook recommends: acceptance criteria that are checkable, documentation that’s available before a dispute ever starts.
- Manufacturing in the same facilities used for batch production, which keeps traceability tight from synthesis to shipment
- Third-party verification of purity on every batch, not a sampling of batches
- A certificate of analysis (COA) available for every product, so procurement can validate specifications during onboarding rather than after a problem surfaces
- A documented claims process for handling disputed results, including comparison against original batch testing
Procurement teams evaluating a new peptide supplier should request the COA before placing a first order, not after receiving product. Cross-check the stated purity against the COA’s own test method and date, and confirm the batch number on the shipment matches the batch number on the certificate. That single step catches the majority of documentation mismatches before they ever become a claim.
What Happens When a Guarantee Is Missing (and When It Works)
The absence of a satisfaction guarantee shows up fastest in disputed shipments. A lab that receives a peptide compound without a matching COA has no fast way to confirm the batch meets spec, so the dispute drags into weeks of back-and-forth testing, exactly the friction a guarantee is designed to eliminate.
Contrast that with a supplier relationship where the guarantee is structured around measurable acceptance criteria. A defense contractor buying custom fasteners, for instance, ties its supplier guarantee to a documented corrective action process, often modeled on formal frameworks like SCAR or 8D, requiring the supplier to identify root cause, not just replace the defective part. That structure turns a single failure into a process improvement instead of a repeated cost.

In research supply chains specifically, the pattern is similar. A lab that switches peptide vendors after a bad batch usually cites the same two reasons: no independent verification of purity, and no clear path to resolution when a batch failed testing. Suppliers offering contractual remedies tied to defined obligations, rather than informal “let us know if there’s a problem” language, tend to keep those relationships longer. The guarantee itself isn’t what retains the customer. The fact that it’s specific enough to act on is.
Author Perspective: Where Guarantees Actually Break Down
Most guarantee disputes aren’t about bad products. They’re about vague language meeting a motivated claimant. A generous refund policy without evidence standards invites serial claims, so pair every remedy with proof requirements: photos, COA comparisons, lab results.
Repair or replacement should be the default for genuine quality failures. Reserve full refunds for cases where those options aren’t practical. Restocking fees on undamaged returns and a cap on claim frequency per account discourage abuse without punishing legitimate complaints.
The real fix isn’t a better refund clause. It’s fewer defects reaching the buyer in the first place, which means supplier audits and tighter selection criteria do more long-term work than any remedy hierarchy.
— Blank Research Team
Request a COA Before Your Next Order
The guarantee described here is built around independent verification that can be checked before placing an order, not after a batch shows up wrong. Products ship with a COA generated from third-party testing, so procurement teams can validate purity claims against defined acceptance criteria, without waiting on a dispute to confirm the numbers.
If you’re onboarding a new peptide supplier or auditing an existing one, start with a batch you can verify against spec. The KISSPEPTIN and SEMAX product pages both list current COA documentation, and the GLOW listing shows how batch traceability is presented for research buyers evaluating a first order. Request a sample batch alongside its COA, run your own acceptance testing, and compare the results against the certificate before scaling up volume.
Sources
- KLAS: Kept promises key for health IT vendor customer satisfaction | TechTarget
- What is Supplier Quality Management? Supplier Selection Criteria | ASQ
- Vendor Partnership Satisfaction – KPI Definition, Formula, & Benchmarks | KPI Depot
FAQ
What Is a Satisfaction Guarantee?
A satisfaction guarantee is a contractual commitment to meet defined quality, performance, or delivery standards, backed by a specific remedy, repair, replacement, or refund, if those standards aren’t met.
What Are Some Examples of a 100% Satisfaction Guarantee?
Common examples include a full refund if a product fails independent lab testing within 30 days, a free replacement for any batch that doesn’t match its COA, or a performance guarantee tied to on-time delivery rates.
What Does a 100% Satisfaction Guarantee Actually Promise?
It promises that if the product doesn’t meet the stated specification, the supplier will make it right at no added cost, but the promise only holds up when it’s tied to measurable, testable criteria rather than subjective satisfaction.
Is an 80% or 90% Vendor Satisfaction Score Good?
An 80% score is generally the industry benchmark for a healthy vendor relationship; scores between 60% and 79% signal room for improvement, and anything below 60% calls for corrective action.
Do Peptide Suppliers Offer a Satisfaction Guarantee?
Some do, typically structured around independent COA verification and a documented claims process rather than a blanket refund, which lets buyers confirm purity before disputing a batch.
Labs: Prevent Peptide Hygroscopicity by Keeping RH Under 30%
Most lyophilized peptides are hygroscopic to some degree, and several sequences deliquesce on contact with humid air. Treat every vial as moisture-sensitive unless you have sequence-specific data proving otherwise. The immediate action: keep vials sealed until they reach room temperature, minimize exposure to open air, and store desiccated. Skip that step and you risk clumping, pH drift, or measurable activity loss before you ever run an assay.
TL;DR:
- Peptides with polar or charged residues are more prone to water sorption, increasing their risk of deliquescence and chemical changes in humid conditions.
- Equilibrating peptides to room temperature before opening minimizes condensation and prevents rapid moisture absorption that can lead to activity loss.
- Using desiccated storage, inner foil packaging with silica gel, and controlling ambient humidity below 30% effectively reduces moisture uptake risks.
- Sequence-specific hygroscopicity varies greatly, so never assume one peptide’s behavior applies to another, even if they look similar in storage.
- Accurate moisture measurement methods like DVS, LF-NMR, and DSC help identify when peptides have absorbed harmful levels of water, guiding appropriate handling actions.
Table of Contents
- Peptide Moisture Absorption: Storage and Handling Rules That Actually Prevent It
- Why Some Peptide Sequences Absorb More Water Than Others
- How Labs Measure Peptide Hygroscopicity in Practice
- Dissolving Hygroscopic Peptides Without Making Things Worse
- Practical Ways to Cut Moisture Uptake in the Lab and in Formulation
- What Moisture Does to Peptide Chemistry Once It’s Absorbed
- Blank Peptides’ QA Approach to Hygroscopic Risk
- Perspective: Where to Spend Your Moisture-Control Budget
- Order Peptides Built for Consistent Handling
- Sources
- FAQ
Peptide Moisture Absorption: Storage and Handling Rules That Actually Prevent It
The window for room temperature storage is narrow. Most lyophilized peptides tolerate room temperature only for a limited period, several months at 4°C, and colder temperatures like negative 20°C for long-term archiving. However, specific sequences with unusually hygroscopic residues may need tighter controls even within those windows. Sigma-Aldrich’s own peptide handling protocol backs this staged approach and recommends equilibrating cold vials to room temperature before opening them.
That equilibration step matters more than most researchers assume. A vial pulled straight from a negative 20°C freezer and cracked open immediately will draw condensation onto the lyophilized cake within seconds, and that condensation is the fastest route to deliquescence you can create in a lab.
Beyond temperature, a handful of habits determine whether your peptide moisture absorption stays negligible or becomes a real problem:
- Aliquot on receipt into single-use portions rather than repeatedly opening one master vial.
- Avoid freeze-thaw cycling once a peptide is in solution; each cycle reintroduces moisture risk and mechanical stress.
- Keep ambient relative humidity below roughly 30% in any space where peptides are opened or weighed.
- Store desiccated whenever the vial isn’t sealed, using a desiccator cabinet or a sealed container with fresh silica gel.
- Request amber vials and sealed foil pouches with integrated desiccant packs from your supplier at order time.
Pro Tip: *Keep a small hygrometer inside your desiccator cabinet.
Why Some Peptide Sequences Absorb More Water Than Others
Lyophilization typically leaves peptides in an amorphous, glassy state rather than a crystalline one, and amorphous solids sorb water into their bulk structure, not just across the surface. That distinction explains why two peptides that look identical in a vial can behave completely differently in humid air. Water vapor sorption research on peptides and proteins shows this bulk sorption can profoundly affect both chemical and physical stability.
Sequence composition drives most of the variation. Polar and charged side chains, lysine, glutamate, serine, and threonine among them, create more sites for water molecules to hydrogen-bond to the peptide backbone. Porous, low-density lyophilized cake structures compound the effect by giving water more surface area to penetrate.
Research on egg-white derived peptides found hygroscopicity varies sharply by sequence, with some peptides fully deliquescing under humid conditions while others stayed comparatively stable. The practical takeaway: don’t assume your peptide behaves like the last one you handled, even if the two look similar on paper.
Absorbed water doesn’t behave as a single uniform pool, either. Researchers generally separate it into:
- Strongly bound water, tightly associated with polar residues and slow to leave even under vacuum.
- Loosely bound or mobile water, which moves through the amorphous matrix and drives most observable changes.
- Bulk water, present once uptake exceeds the peptide’s capacity to bind it, often the trigger for visible deliquescence.
Some structural changes caused by that mobile water fraction don’t fully reverse once you dry the sample back out, which is exactly why prevention beats correction.
How Labs Measure Peptide Hygroscopicity in Practice
Quantifying moisture uptake isn’t guesswork if you have access to the right instruments. Three methods dominate the literature and cover the practical questions most labs actually need answered.
- Dynamic Vapor Sorption (DVS) exposes a sample to stepped relative humidity levels and tracks mass gain in real time, producing a sorption isotherm that shows equilibrium moisture content at each RH step. DVS studies on egg albumen peptide powder demonstrate how this method reveals both sorption kinetics and the RH threshold where uptake accelerates sharply.
- Low-field NMR (LF-NMR) measures water mobility rather than total mass, separating water into distinct T2 relaxation fractions. A study on soybean antioxidant peptide powder used LF-NMR to show which water fraction correlates with structural change, giving more actionable insight than a moisture-content number alone.
- Differential Scanning Calorimetry (DSC) detects glass transition shifts and other thermal signatures that indicate whether absorbed water has altered the peptide’s physical structure.
Run replicates, choose RH steps that bracket your actual storage environment, and treat any jump in mobile water fraction as a signal to requalify the lot before use.
Dissolving Hygroscopic Peptides Without Making Things Worse
A damp or partially deliquesced peptide doesn’t have to go straight in the trash, but it does demand a more careful reconstitution process than a fresh, dry vial.
Test on a small aliquot first, never the full vial. Solvent choice should follow the peptide’s net charge and hydrophobicity: dilute acetic acid or dilute ammonium hydroxide for peptides with strongly charged residues, buffered saline for more neutral sequences, and a small percentage of DMSO as a co-solvent for hydrophobic sequences prone to aggregation. Sigma-Aldrich’s solubility guidance lays out this charge-first approach and remains a solid starting reference.
If the powder shows visible clumping but hasn’t fully liquefied, vacuum desiccation or re-lyophilization can sometimes recover usable material. If it has visibly deliquesced into a syrup or shows discoloration, discard it. Recovering activity from a fully deliquesced sample is unreliable enough that it’s rarely worth the assay time.
- Prepare concentrated working stocks rather than dilute ones; concentrated stocks resist further degradation better.
- Clarify with a 0.22-micron sterile filter when the application demands it, especially for cell-based assays.
- Note how long a reconstituted stock has been in solution. Most working stocks lose measurable activity within days at 4°C, faster at room temperature.
Pro Tip: If you’re unsure whether a sequence leans hydrophobic or hydrophilic, look at the ratio of charged residues (Lys, Arg, Glu, Asp) to nonpolar ones (Leu, Ile, Val, Phe). More charged residues generally means better aqueous solubility and, often, more hygroscopic behavior in dry form.
Practical Ways to Cut Moisture Uptake in the Lab and in Formulation
Two layers of defense work here: what you do at the bench, and what you ask your supplier to build in before the peptide ever reaches you.
At the bench, multi-layer packaging, an inner foil pouch inside an outer container, backed by a fresh desiccant sachet, blocks most ambient humidity from reaching the peptide. Flushing headspace with dry nitrogen or argon before resealing a vial adds another layer of protection for sequences you already know run hygroscopic. Silica gel desiccants work for general use; molecular sieve desiccants pull moisture more aggressively and suit peptides with documented high sensitivity.
At the formulation level, published approaches go further:
- Embedding the peptide in a gelatin matrix reduced moisture absorption and preserved activity in walnut peptide research.
- Chelating with metal ions such as zinc showed a similar protective effect in that same study, reducing uptake under high-humidity conditions.
- Specifying moisture-content limits and packaging requirements directly in your purchase order gives suppliers a concrete target instead of a vague request.
Each of these carries trade-offs. Embedding agents and metal chelators can interfere with certain assay chemistries, so confirm compatibility with your downstream application before choosing a formulation-level fix over a simpler packaging change.
What Moisture Does to Peptide Chemistry Once It’s Absorbed
Moisture doesn’t just sit inertly in a peptide cake. It actively catalyzes oxidation of residues like methionine, tryptophan, and cysteine, even in otherwise controlled storage conditions.
Documented consequences go beyond simple potency loss. Research on a cysteine-containing peptide found that moisture exposure caused measurable pH shifts, reduced antioxidant activity, and structural changes detectable by thermal and spectroscopic methods, some of which didn’t fully reverse after re-drying.
Practical checks matter more than theory here. Watch for clumping, discoloration, or a change in cake texture, and run a quick functional assay on any lot with a suspected moisture incident before trusting quantitative results from it.
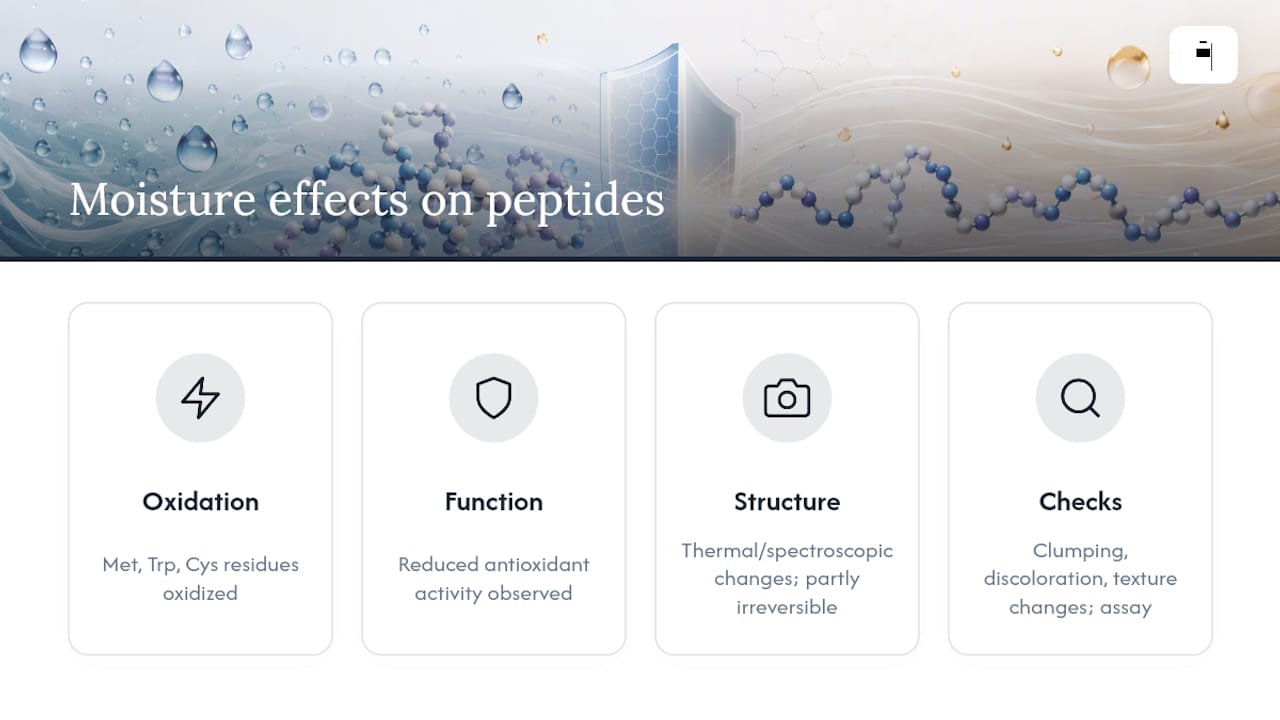
Blank Peptides’ QA Approach to Hygroscopic Risk
Every batch Blankpeptides ships carries a certificate of analysis and is manufactured in a USA-based facility with independent verification confirming greater than 99% purity. When you order, ask specifically about moisture-content specifications, packaging format, and whether desiccant is included in the shipment.
A basic receiving checklist covers most of what matters: confirm the COA matches the lot number on the vial, inspect for any visible clumping or discoloration on arrival, and log the ambient humidity of your storage area at intake. Any deviation from expected appearance is worth flagging before you commit the material to a critical experiment.
Perspective: Where to Spend Your Moisture-Control Budget
Every lab should equilibrate vials before opening and store desiccated. Those are non-negotiable baseline habits, essentially free. Premium controls like nitrogen flushing or formulation additives earn their cost only for sequences with documented high hygroscopicity. Prioritize sequence-specific testing and lot-level COA review over blanket protocols, and log every humidity incident against its lot number. That record becomes your best predictor of which sequences actually need the extra protection.
— Blank Research Team
Order Peptides Built for Consistent Handling
Reliable moisture control starts before the peptide ever reaches your bench, and that begins with who supplies it. Blankpeptides manufactures every product in USA-based facilities and verifies each batch independently for greater than 99% purity, with a certificate of analysis available for every lot you order.

When you place an order, ask directly about packaging format, desiccant inclusion, and moisture-content specifications for the specific sequence you need. Researchers working with sensitive compounds can review the KISSPEPTIN product page for an example of how COA data and packaging details are presented, or check the SEMAX listing for another sequence with full batch documentation. Peptides like VIP, DSIP, KLOW, and GLOW are all shipped with the same batch-level verification. Browse the current catalog and request a COA before your next order goes in.
Sources
- Water vapor sorption by peptides, proteins and their formulations
- Water dynamics of Ser-His-Glu-Cys-Asn powder and effects of moisture absorption on its chemical properties
- Dynamics of water mobility and distribution in soybean antioxidant peptide powders monitored by LF-NMR
FAQ
How long can a peptide like BPC-157 stay unrefrigerated?
Most lyophilized peptides tolerate room temperature only for a limited period, but sequence-specific hygroscopicity can shorten that window, so refrigeration or freezing remains the safer default for extended storage.
How should I use lyophilized peptides after storage?
Equilibrate the vial to room temperature before opening to prevent condensation, reconstitute with a solvent matched to the peptide’s charge profile, and use the working stock promptly rather than storing it in solution long term.
How can I tell if a peptide is hydrophobic or hydrophilic?
Check the sequence for the ratio of charged residues like lysine and glutamate against nonpolar residues like leucine and valine; more charged residues generally point to hydrophilic behavior and easier aqueous solubility.
What destroys peptide activity fastest?
Moisture-driven oxidation of residues like methionine, tryptophan, and cysteine, along with repeated freeze-thaw cycling and extended storage in solution, are the fastest routes to activity loss.
By $/Verified mg and Testing Costs: Research Peptide Pricing for Labs
Compare research peptide offers by cost per verified milligram, not by vial sticker price. A $200 vial at 99% purity with a batch-specific Certificate of Analysis often beats lower-priced vials of unknown purity once you normalize the numbers. Budget separately for independent testing and shipping, since both are recurring costs, not one-time surprises. Some vendors publish batch COAs and manufacture in the USA, giving procurement teams a documented baseline to compare against.
TL;DR:
- The true cost per verified milligram depends heavily on purity, sequence length, modifications, testing, and logistics costs, not the vial sticker price alone.
- Comparing vendors requires adjusting prices for purity and form (salt or hydrate) using a standard formula and benchmarking against market median values around $6.38 per mg.
- Independent verification, clear documentation, and vendor transparency about manufacturing location and testing methods are essential before purchase.
- International shipping, customs duties, and re-verification costs significantly increase the total expenditure beyond the initial vial price, especially outside the US.
- Building a comprehensive peptide budget should include verified mg costs, shipping, independent testing reserves, and contingency funds for failed batches.
Table of Contents
- Quick Checklist: Is This Listing Worth Your Time?
- What Actually Drives Research Peptide Prices?
- How Do You Calculate Cost Per Verified Milligram?
- Building a Lab-Ready Peptide Budget Template
- Verification Checklist: What to Demand Before You Pay
- What Documentation Should a Peptide Supplier Provide?
- Typical Price Ranges by Peptide Class
- What’s the Real Total Cost, Beyond the Vial Price?
- A Procurement Culture That Verifies First
- Where Blank Peptides Fits Your Procurement Checklist
- Where to Verify Prices and Vendor Claims
- Sources
- FAQ
Quick Checklist: Is This Listing Worth Your Time?
Before you spend ten minutes building a spreadsheet model, run any listing through this two-minute filter.
- Labeled mg matches COA mass. The vial should state milligram content, and a lot-specific COA should confirm that mass at a stated purity.
- Purity is stated as a number, not a marketing phrase. “Highly pure” means nothing. “>99% by HPLC” means something.
- Run the quick math. Divide the listed price by (labeled mg × purity percentage) to get a rough $/verified mg. Compare that against a market benchmark like the Peptide Price Index, which puts the median around $6.38 per mg across indexed vendors.
Red flags that end the evaluation immediately: no COA offered on request, a price less than half the index median for that peptide class, or a seller who cannot name the testing lab that ran the analysis.
What Actually Drives Research Peptide Prices?
Sequence length is the biggest lever. Each amino acid added to a chain requires another coupling cycle during solid-phase synthesis, and every cycle carries its own reagent cost and failure risk. A 5-residue fragment and a 40-residue chain are not the same manufacturing problem, even if both ship in identical 5mg vials.
Purity tier is the second major driver, and it does not scale linearly. Getting from 90% to 95% purity is a modest purification step. Getting from 95% to beyond 99% often means additional preparative HPLC passes, and each pass loses product and adds labor. That gap is sometimes called the purity premium, and it is real: pushing a batch from research-grade to verified ultra-high purity can add a meaningful chunk to unit cost even though the mass barely changes.
Beyond sequence and purity, four cost categories separate a $40 vial from a $300 vial:
- Modifications. Acetylation, amidation, PEGylation, or disulfide bridging each require extra synthesis or purification steps.
- Analytical testing. Independent HPLC and mass spectrometry confirmation is not free, and documentation-first pricing frameworks note that third-party characterization can run from a few hundred to several thousand dollars depending on analysis depth.
- Lyophilization and vial fill. Freeze-drying equipment time and precise fill-weight control both add labor cost per unit.
- Cold-chain logistics. Peptides degrade at room temperature over time, so insulated packaging and expedited shipping are baked into the price, not optional add-ons.
Pro Tip: Ask any vendor for the specific purity method used (HPLC-UV vs. LC-MS) before comparing purity percentages across listings. The two methods aren’t interchangeable, and a vendor quoting “99% pure” without naming the method is telling you less than it sounds like.
How Do You Calculate Cost Per Verified Milligram?
The formula is simple, but almost nobody in this market actually uses it consistently. That is the entire reason vial sticker prices mislead buyers so often.
Cost per verified mg = (Vial price + prorated shipping) ÷ (Labeled mg × verified purity %)
Add a second line for testing overhead if you plan to independently confirm the vendor’s COA, which serious labs should do periodically rather than trusting every batch blindly.
- Pull the labeled mg and stated purity from the listing and the COA.
- Add prorated shipping cost to the vial price.
- Divide by (labeled mg × purity, expressed as a decimal).
- Compare the result against a market median, not against another single vendor.
Here is a worked comparison of two hypothetical listings for the same peptide class:
Vendor A looks pricier on the sticker but is actually cheaper once purity and mass are normalized, a gap that gets bigger when a peptide arrives as a salt or hydrate form. Salts add non-peptide mass to the vial, so a COA reporting “peptide content” separately from “total mass” matters more than most buyers realize. Normalizing to $/mg adjusted for purity is the only way to catch this kind of distortion before it hits your budget.
Building a Lab-Ready Peptide Budget Template
A defensible peptide budget has four lines, not one. Treat the vial price as the smallest of the four line items, not the whole budget.
- Verified mg cost. Price per verified milligram, multiplied by monthly consumption.
- Shipping and payment surcharges. Cold-chain shipping and card-processing fees, which some vendors pass through separately.
- Independent-testing reserve. A recurring line for periodic third-party HPLC/MS re-verification, even on vendors you trust.
- Contingency. A cushion for failed verification, delayed shipments, or a batch that fails your own incoming QC.
To convert dosing into monthly cost, start with your protocol’s mg-per-week usage, multiply by 4.33 weeks, and divide by the vial’s verified mg content to get vials needed per month. Multiply that by your calculated $/verified mg.
| Budget Line | Sample Monthly Allocation |
|---|---|
| Verified mg cost | $140 |
| Shipping/surcharges | $18 |
| Testing reserve | $22 |
| Contingency | $20 |
| Total | $200 |
That total sits comfortably inside the $28 to $180 monthly protocol range reported across real vendor pricing, once you account for a compound on the higher end of dosing. A documentation-first budgeting framework recommends holding a validation buffer of roughly 20% specifically for new-vendor onboarding.
Pro Tip: Build the testing reserve into your budget even for vendors who supply a COA. A COA tells you what the seller’s lab found; it doesn’t replace an independent check on your first order from a new source.
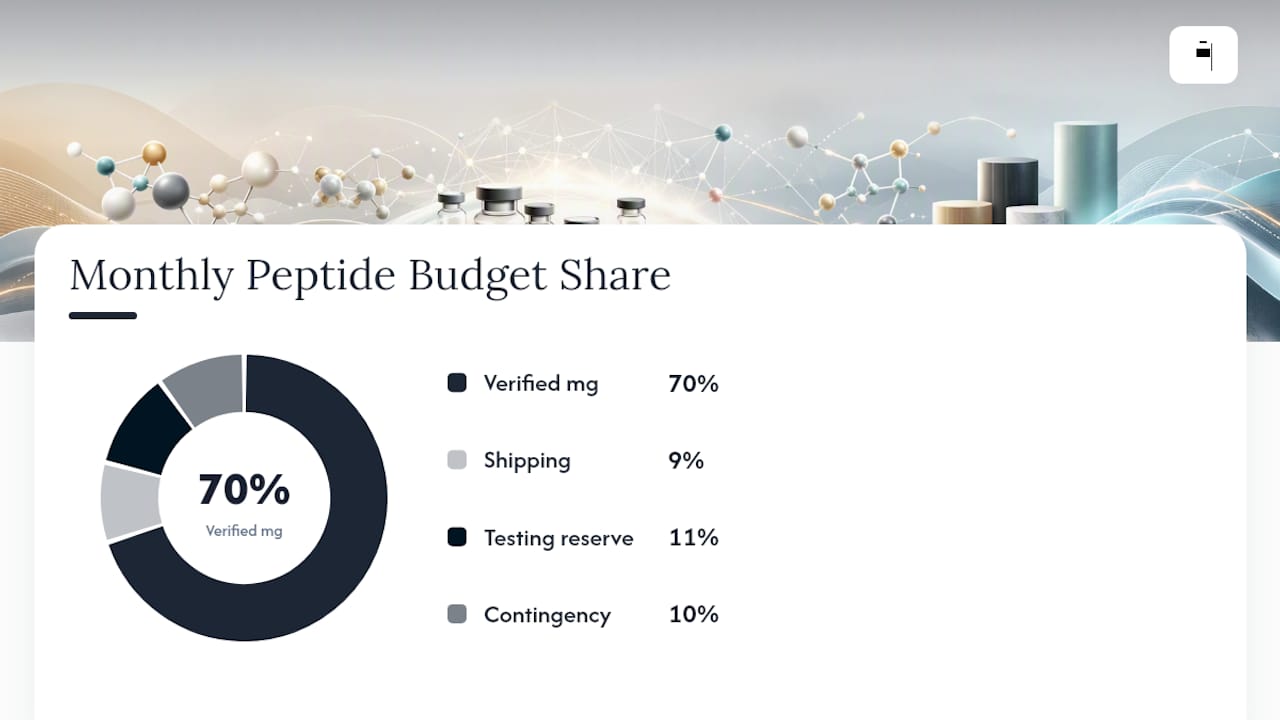
Verification Checklist: What to Demand Before You Pay
Treat these as non-negotiable, not nice-to-haves:
- Require a lot-specific COA, not a generic product-page PDF that could apply to any batch.
- Verify the testing lab’s identity independently. A lab name with no findable address or accreditation is a red flag on its own.
- Confirm vial mg against COA-verified mass, and ask directly whether the compound is a salt or hydrate form.
- Get lead time, current stock status, and cold-chain shipping method in writing before you pay.
- Confirm refund policy and dispute resolution terms exist in writing, not just as a verbal promise.
Immediate disqualifiers: no COA available on request, pricing dramatically below the market median for that peptide class, and payment accepted only through cryptocurrency with no other option.
Pro Tip: *If a vendor’s price for TB-500 or another common peptide sits far below what similar listings charge, don’t assume you have found a deal.
What Documentation Should a Peptide Supplier Provide?
Procurement teams evaluating any peptide vendor, including Blank Peptides, should expect these proof points as table stakes rather than differentiators:
- Country of manufacture stated plainly, ideally tied to a registered facility, not a vague “quality sourced” claim.
- Purity threshold specified as a number (Some vendors state >99% purity across their catalog) rather than a marketing adjective.
- Batch-specific COA available on request, covering the exact lot shipped, not a representative sample from a different production run.
- Independent verification practices disclosed, including which testing methods confirm identity and purity.
- Order-to-delivery timeline stated upfront, so labs can plan protocol start dates around realistic processing windows.
A vendor comparison built on Boren Health’s purity-scored product listings can help you sanity-check where a given supplier’s stated purity falls relative to the broader market before you commit a full order.
Typical Price Ranges by Peptide Class
Short-chain peptides, generally under 10 residues, tend to sit at the lower end of the market because synthesis requires fewer coupling cycles and less purification effort. Expect these to price out favorably on a $/verified mg basis compared to longer chains, though small vial sizes can make the sticker price look deceptively low.
Medium-length research peptides, roughly 10 to 30 residues, occupy the bulk of the catalog most labs order from.
Long-chain and heavily modified peptides climb further, driven by cumulative coupling failures at length and by the extra purification steps needed to isolate a clean product from a longer, more error-prone synthesis run.
GLP-1 receptor agonist class compounds sit at the top of most price lists, reflecting both molecular complexity and current demand pressure on manufacturing capacity. Across the market, real vendor pricing surveys show single-vial list prices ranging broadly, with the GLP class frequently landing in the higher price bands. That spread is exactly why $/verified mg matters more here than in any other category. Two GLP-class vials priced $200 apart can normalize to nearly identical real cost once you account for differing mg content and purity.
What’s the Real Total Cost, Beyond the Vial Price?
The vial price is rarely the full invoice. For domestic USA orders, the additions are modest but real: expedited or cold-chain shipping typically adds a flat fee per shipment rather than scaling with order size, and payment processing surcharges (particularly for card payments passed through by smaller vendors) can add a small percentage on top.
International orders carry a heavier tail. Customs duties and import handling fees vary by destination and can add a meaningful percentage to the landed cost, and some couriers charge a separate customs-processing fee on top of any government-assessed duty. Cold-chain packaging for international transit also costs more than domestic shipping, since transit time is longer and insulation requirements are stricter.
Then there’s the cost most labs forget to line-item: independent verification. If your protocol calls for confirming a new vendor’s COA with your own third-party lab, that testing cost belongs in the same total-cost calculation as the vial price and shipping, not treated as a separate, optional expense. Documentation-first budgeting frameworks treat this as a fixed line rather than an occasional expense specifically because skipping it is how labs end up with unusable material and no recourse.
Add a contingency line for the scenario where a batch fails your incoming QC and needs replacement or refund processing. A total cost model that only accounts for vial price and shipping will consistently underestimate real quarterly spend by a wide margin once these overhead lines are included.
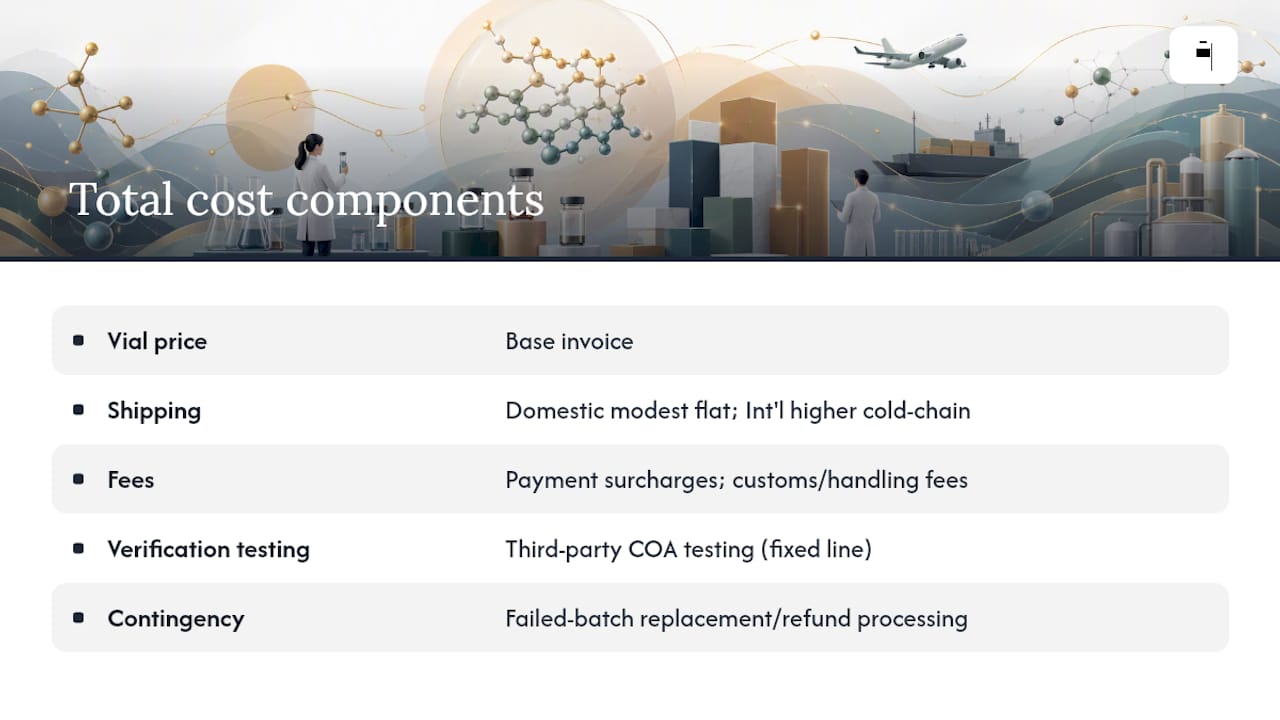
A Procurement Culture That Verifies First
Price should never be the first filter. When a batch clears verification, the purity premium usually looks smaller than it did on the spreadsheet, because failed re-orders and wasted lab time cost more than the price gap ever did.
— Blank Research Team
Where Blank Peptides Fits Your Procurement Checklist
That combination is what lets procurement teams skip the guesswork stage and move straight to comparing $/verified mg across real, documented options.
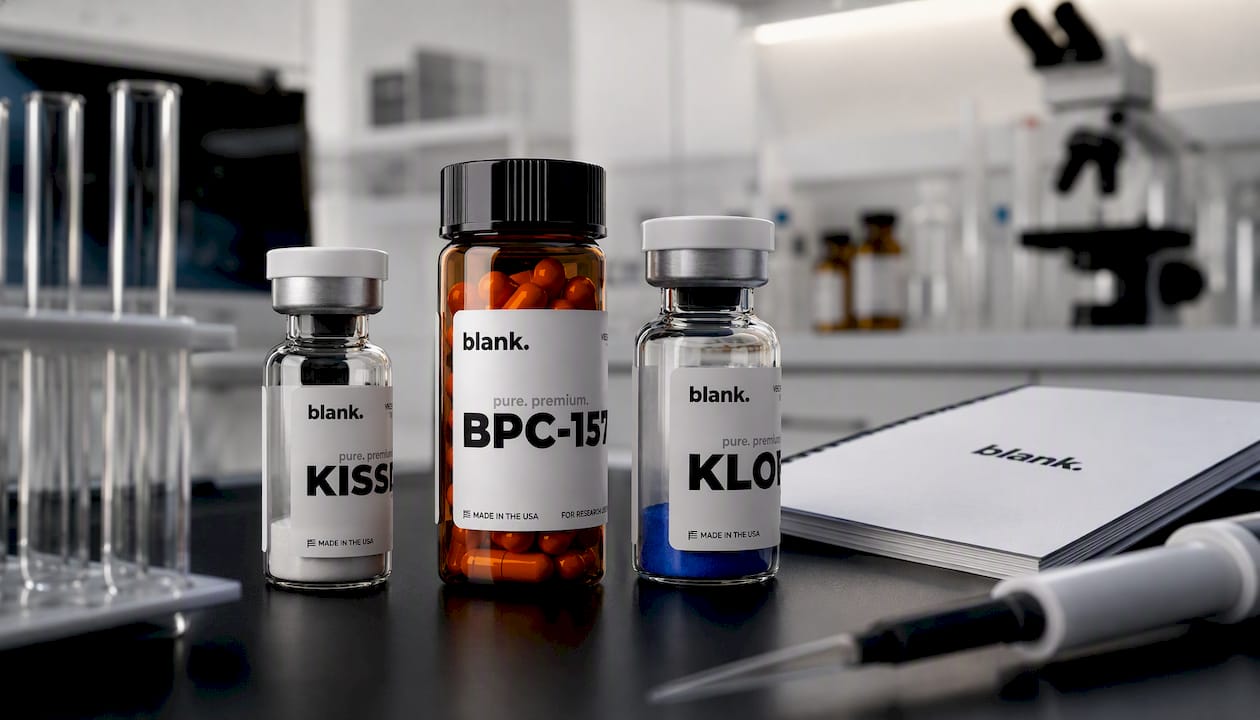
The catalog includes practical entry points for labs building out a protocol budget. KISSPEPTIN is a common starting point for teams working on appetite and reproductive-axis research models. The BPC-157 capsule format gives labs a stable, easy-to-dose option outside traditional reconstitution workflows. And KLOW offers a larger-fill blend for labs running higher-volume protocols who want fewer reorders per quarter.
Request a lot-specific COA before your first order, or contact the sales team directly for institutional quote volume. Either path starts the same way: order direct and verify what arrives against the documentation you were promised.
Where to Verify Prices and Vendor Claims
Cross-check any quote against the Peptide Price Index for a live median benchmark, and use purity-scored product comparisons to sanity-check a vendor’s stated purity against similar catalog listings before committing budget.
Sources
- Peptide Price Index 2026: Median $/mg Across 66 Vendors
- Peptide Prices Compared: Cost per mg Adjusted for Purity
FAQ
Can anyone buy research peptides?
Reputable suppliers, including Blank Peptides, restrict sales to qualified researchers purchasing for laboratory research use only, not for personal consumption.
Is buying research peptides legitimate?
Yes, when purchased from a documented supplier for legitimate lab research. Legitimacy hinges on batch-specific COAs, disclosed manufacturing location, and independently verifiable purity claims rather than the transaction type itself.
How much do three months of peptides typically cost?
Monthly protocol costs commonly range from $28 to $180 depending on compound and dose, so a three-month protocol typically runs proportionally before testing and shipping overhead.
Where can I buy retatrutide research peptide?
GLP-class compounds like retatrutide should only be sourced from vendors offering a lot-specific COA and disclosed manufacturing origin. Compare any quote against the market price index before ordering, since this class shows some of the widest price spreads in the entire market.
Obesity Peptide Research: Turn 20% Trial Results Into Human Trials
Incretin-based peptides, semaglutide, tirzepatide, and multi-agonist compounds like retatrutide, now carry the strongest clinical evidence in obesity peptide research, with weight loss magnitudes up to about 20% in trial populations. Non-incretin candidates, including endogenous fragments, food-derived peptides, and short novel sequences like BRP and D3, show compelling mechanisms in rodent and porcine models but lack comparable human data. The field’s real bottleneck isn’t discovering new targets. It’s solving stability, delivery, and lean mass preservation well enough to move a promising mouse result into a defensible first-in-human protocol.
TL;DR:
- Peptides like semaglutide, tirzepatide, and retatrutide show up to 20% weight loss in trials, but stability, delivery, and lean mass preservation remain technical hurdles.
- Most adverse events, mainly gastrointestinal, are linked to dose escalation speed, emphasizing slow titration for better tolerability and fewer discontinuations.
- Multi-agonists outperform single-receptor drugs by activating gut-brain pathways and energy expenditure mechanisms, yet their broader safety profiles need close monitoring.
- Efforts to diversify mechanisms beyond incretin pathways, such as browning fat or microbiome-linked effects, are promising but still mostly preclinical and mechanistically exploratory.
- Accurate peptide sourcing and rigorous assay reporting are essential for reproducibility, with translational efforts focused on optimizing pharmacokinetics and safety before human trials.
Table of Contents
- The Clinical Landscape of Obesity Peptide Research
- How Do Peptides Affect Obesity at the Receptor Level?
- Emerging Non-Incretin Peptides Worth Watching
- Peptide Engineering Strategies for Better Half-Life and Delivery
- Preclinical to Clinical Translation: What the Pipeline Should Look Like
- Safety Signals and Clinical Monitoring in Peptide Trials
- Methods and Assays for Identifying Anti-Obesity Peptides
- Sourcing Research-Grade Peptides for Rigorous Studies
- Where Obesity Peptide Research Should Focus Next
- Get Research-Grade Peptides for Your Obesity Studies
- Further Reading and Primary Sources
- Sources
The Clinical Landscape of Obesity Peptide Research
Three drug classes dominate the current evidence base, and the gap between them and everything else is wide enough that researchers need to keep the two categories mentally separate: approved or late-stage incretin drugs, and everything still in earlier development.
Semaglutide’s STEP trial program established the modern benchmark, with participants losing about 15% of body weight over a full treatment period alongside lifestyle intervention. That figure reshaped what “efficacy” means in obesity pharmacotherapy almost overnight. Tirzepatide, a dual GIP/GLP-1 receptor co-agonist, pushed further. The SURMOUNT and SURPASS trial programs reported weight reductions approaching 20% in obesity trials, plus substantial HbA1c improvements in the type 2 diabetes populations studied under SURPASS. Adding a second receptor target didn’t just replicate semaglutide’s effect. It amplified it, which is the strongest argument yet for polypharmacology over single-receptor agonism in this drug class.
Retatrutide takes the co-agonist logic one step further as a GIP/GLP-1/glucagon tri-agonist. Phase 2 data have shown some of the largest weight loss signals reported for injectable peptides to date, and the glucagon receptor component may add an energy expenditure lever that GLP-1 and GIP agonism alone do not provide. It remains investigational, and phase 3 outcomes will determine whether the tri-agonist approach holds up at scale or introduces tolerability trade-offs that erode its advantage.
Cagrilintide, an amylin analog, has been studied in combination with semaglutide under the CagriSema program. Pairing an amylin pathway with GLP-1 agonism targets satiety and gastric emptying through partially distinct mechanisms, and early combination data suggests an additive rather than merely overlapping effect. Development is ongoing, and the combination has not reached the regulatory maturity of tirzepatide or semaglutide alone.
Adverse events across these programs cluster tightly around the gastrointestinal system:
- Nausea, vomiting, and diarrhea are the most frequently reported effects, generally concentrated during dose escalation.
- Discontinuation rates tied to GI intolerance run higher in aggressive titration schedules than in slow, stepwise ones.
- Gallbladder-related events appear at low but consistent rates across GLP-1 trial populations.
- Pancreatitis signals remain rare but warrant monitoring in trial design.
Regulatory status varies sharply by compound. Semaglutide and tirzepatide hold approvals for weight management and type 2 diabetes indications depending on formulation and dose. Retatrutide and cagrilintide combinations remain investigational, with no approved obesity indication yet. That distinction matters for anyone designing a research protocol that references these compounds, since “peptide class with proven efficacy” and “peptide class with regulatory approval” are not interchangeable claims.
How Do Peptides Affect Obesity at the Receptor Level?
The mechanistic story starts in the gut and ends in adipose tissue, with the brain doing most of the coordination in between.
GLP-1 receptor activation slows gastric emptying, enhances glucose-dependent insulin secretion, and signals satiety centers in the hypothalamus and brainstem. GIP receptor co-activation appears to potentiate this effect rather than compete with it, which is part of why tirzepatide outperforms single-target GLP-1 agonists. Glucagon receptor engagement, the third leg of retatrutide’s mechanism, pushes hepatic glucose output and lipolysis in ways that can raise resting energy expenditure. Stacking these three pathways is mechanistically elegant. It’s also why multi-agonist compounds tend to produce larger weight loss signals than any single-receptor predecessor, at the cost of a broader adverse-event surface to monitor.
Adipose tissue itself is a therapeutic target, not just a passive depot. White adipose tissue stores energy; brown and “beige” adipose tissue burn it through thermogenesis. Browning, the induction of beige adipocyte characteristics within white fat depots, has become a serious research goal because it offers an energy-expenditure lever that’s mechanistically distinct from appetite suppression. Peptide-driven browning remains mostly preclinical, but it represents one of the more promising non-incretin angles precisely because it doesn’t rely on the same GI-linked satiety pathways.
Gut-brain signaling extends beyond the classic incretin axis. The uroguanylin-GUCY2C (UGN-GUCY2C) pathway illustrates this well: it’s a gut-derived signaling route linked to satiety and energy balance that operates independently of GLP-1 biology, and it’s increasingly discussed as a model for microbiome-adjacent mechanisms in obesity peptide research.
Quick take: Semaglutide’s STEP program showed roughly 15% weight loss, while tirzepatide’s SURMOUNT/SURPASS data reported weight loss figures approaching 20%, a gap large enough to reshape which receptor targets attract the most preclinical investment right now.
Lean mass preservation deserves its own line of mechanistic inquiry. Rapid pharmacologic weight loss doesn’t discriminate cleanly between fat and lean tissue loss, and body composition endpoints, not just scale weight, are becoming a standard requirement in serious trial design:
- DEXA-measured fat mass versus lean mass ratios, not total weight change alone.
- Resting metabolic rate shifts that might signal adaptive thermogenesis.
- Muscle protein synthesis markers in trials extending beyond 24 weeks.
Emerging Non-Incretin Peptides Worth Watching
Beyond the incretin axis, a smaller but genuinely interesting set of candidates is generating preclinical attention, and it’s worth treating each on its own evidentiary merits rather than lumping them together as “the next GLP-1.”
BRP stands out because its proposed mechanism sidesteps the nausea pathway that limits GLP-1 tolerability. Preclinical work reports that BRP reduces food intake in both mice and pigs without triggering the aversive response typically seen with incretin agonism, which, if it replicates in larger models, would address one of the most persistent tolerability complaints in the entire drug class. D3, a related short peptide, produced roughly 12% weight reduction in mice acting through the UGN-GUCY2C axis described above, a gut-microbiota-linked pathway distinct from classic incretin signaling.
Non-incretin candidates like BRP and D3 matter less for their raw efficacy numbers, which remain rodent-derived and preliminary, and more for the mechanistic diversification they represent. A field entirely dependent on GLP-1 biology is a field with a single point of failure if tolerability or manufacturing constraints ever bite.
Food-derived peptides form a separate, less flashy but methodologically instructive category. Systematic reviews of in silico-to-in vivo pipelines show that molecular docking predictions of pancreatic lipase inhibition by peptides isolated from dietary protein sources have, in a meaningful number of cases, held up under subsequent in vitro and in vivo testing. Some of these peptides also show PPAR-modulating activity relevant to adipogenesis. The translational value here isn’t any single peptide’s efficacy; it’s evidence that computational screening for this peptide class produces hits that survive experimental scrutiny more often than skeptics might assume.
MOTS-c and AOD-9604 come up constantly in both research and consumer contexts, and they deserve a clear evidence-level statement. MOTS-c is a mitochondrial-derived peptide studied for roles in metabolic regulation and insulin sensitivity, with data still concentrated in cell and animal models. AOD-9604, a modified fragment of human growth hormone, has circulated in research and bodybuilding contexts for years, but as Harvard Health notes, peptides in this tier, AOD-9604 included, lack the large-scale randomized human trial data that supports GLP-1 receptor agonists. That doesn’t disqualify them from research interest. It means any claim about their obesity-relevant efficacy in humans should be labeled as preliminary, not established.
For researchers deciding where to allocate translational effort among these non-incretin candidates, three questions tend to separate promising leads from dead ends:
- Is the mechanism distinct enough to matter? A peptide that duplicates GLP-1 signaling with no tolerability advantage adds little strategic value.
- Is the pharmacokinetic profile tractable? Short native peptides with sub-hour half-lives need an engineering plan before they’re worth extensive in vivo investment.
- Does the safety signal hold across species? Rodent tolerability that doesn’t replicate in a second species is a common and expensive failure point.
Peptide Engineering Strategies for Better Half-Life and Delivery
Native peptides rarely survive long enough in circulation to be clinically useful on their own, which is why half-life extension has become its own subdiscipline within obesity peptide research.
Albumin-binding lipidation, attaching a fatty acid chain that reversibly binds serum albumin, is the strategy behind semaglutide’s once-weekly dosing and remains the most clinically validated approach in this category. PEGylation, attaching polyethylene glycol chains, extends circulation time through increased hydrodynamic size and reduced renal clearance, though it can sometimes reduce receptor binding affinity if not positioned carefully. Peptidomimetics, non-peptide or partially modified structures that retain receptor activity while resisting enzymatic degradation, offer another route entirely, trading some synthesis complexity for markedly improved stability.
Azapeptides represent a newer and genuinely interesting variation on peptidomimetic design. Substituting an alpha-carbon with nitrogen at strategic positions, position 8 in GLP-1 analogues, for instance, can substantially increase resistance to DPP-4 and other proteases while preserving receptor potency. An azapeptide GLP-1 analogue tested in high-fat-diet mouse models showed extended in vitro half-life and reduced weight gain relative to vehicle controls and some comparator peptides, a promising early signal for a modification strategy that’s still relatively underused compared with lipidation.
Delivery route is its own translational puzzle. Most approved incretin peptides require subcutaneous injection, which is clinically manageable but far from ideal for long-term adherence in real-world settings. Oral peptide formulations exist, semaglutide has an oral form, but they typically require absorption enhancers or specialized coatings to survive gastric conditions, and bioavailability tends to run far lower than injectable routes. Any preclinical program evaluating a new peptide should decide early which delivery route it’s optimizing for, because the formulation data needed for oral versus injectable development diverge almost from day one.
Recommended assays for evaluating half-life extension strategies before committing to expensive in vivo work:
- DPP-4 resistance assays, measuring degradation kinetics in the presence of the enzyme most responsible for native GLP-1 breakdown.
- Ex vivo whole-blood stability testing, which captures a broader protease environment than isolated enzyme assays.
- Receptor binding affinity comparisons pre- and post-modification, to confirm the stability gain didn’t cost potency.
Pro Tip: Run DPP-4 resistance and ex vivo whole-blood stability assays in parallel, not sequentially. A modification that survives isolated DPP-4 exposure but degrades quickly in whole blood will waste months of in vivo planning before that mismatch surfaces.
Preclinical to Clinical Translation: What the Pipeline Should Look Like
A disciplined screening cascade catches weak candidates early, before they consume animal resources or, worse, reach a first-in-human protocol under false confidence.
- In silico screening. Molecular docking and structure-based virtual screening narrow candidate pools by predicting receptor or enzyme interactions, though docking scores alone should never be treated as proof of activity.
- In vitro functional assays. cAMP accumulation assays and beta-arrestin recruitment assays confirm actual receptor engagement for GPCR-targeting peptides; enzyme inhibition assays serve the same purpose for lipase- or PPAR-directed candidates.
- PK/PD characterization. Half-life, protease resistance, and dose-response relationships need establishing before any efficacy claim is meaningful.
- Small-animal efficacy studies. Diet-induced obesity mouse models remain the field’s workhorse for initial efficacy signals, tracking food intake, body weight, and metabolic parameters over defined windows.
- Larger-animal validation. Porcine models, as used in BRP research, offer physiology closer to humans and help catch species-specific mechanism failures before they reach the clinic.
Endpoints matter as much as the model. Food intake and body weight are the obvious ones, but body composition via DEXA, indirect calorimetry for energy expenditure, glucose tolerance testing, and lipid panels together paint a far more complete metabolic picture than weight alone ever could.
Three translational pitfalls account for a disproportionate share of failed programs. Species differences in receptor pharmacology mean a peptide’s mouse-model potency doesn’t guarantee equivalent human receptor affinity. Dosing frequency mismatches between rodent metabolism and human pharmacokinetics can make an efficacious mouse protocol translate poorly to a once-weekly human regimen. Route-dependent PK differences between the injection method used preclinically and the intended clinical delivery route can quietly invalidate exposure assumptions carried forward from animal data.
Before any first-in-human study, ethical and regulatory checkpoints, IND-enabling toxicology, genotoxicity screening, and institutional review board clearance, need to be built into the timeline from the earliest preclinical planning stages, not treated as a late-stage formality.
Safety Signals and Clinical Monitoring in Peptide Trials
Gastrointestinal effects remain the dominant safety theme across incretin peptide trials, and they’re the leading driver of dose discontinuation in dose-escalation studies. Nausea and vomiting cluster early in titration; slower escalation schedules consistently reduce dropout compared with aggressive ones.
Discontinuation in major GLP-1 and multi-agonist trials tracks closely with titration speed, a pattern that shows up across the semaglutide and tirzepatide trial data and reinforces that slow dose escalation is considered a safety measure, not just a tolerability nicety.
A reasonable monitoring panel for researchers designing early-phase peptide studies includes:
- Fasting glucose and HbA1c, to track both efficacy and hypoglycemia risk in combination regimens.
- Lipid panels, given the metabolic shifts these compounds induce.
- Liver function tests and renal function markers, standard for any systemically administered peptide.
- Electrolyte panels, particularly in studies involving significant caloric reduction.
- Thyroid function testing when the compound class carries a relevant signal, as with certain GLP-1 agonists in specific populations.
Lean mass loss during rapid pharmacologic weight reduction is a real and increasingly discussed limitation, not a footnote. Clinical guidance supports countermeasures: structured resistance training combined with protein intake around 1.2 to 1.6 grams per kilogram of ideal body weight appears to meaningfully preserve lean tissue during rapid weight loss phases. Any translational protocol modeling human outcomes should build body composition monitoring into its design rather than defaulting to scale weight as the primary endpoint.
Special-population considerations round out the safety picture. Labeling for approved incretin drugs flags contraindications in patients with a personal or family history of medullary thyroid carcinoma, and caution is warranted in anyone with a history of pancreatitis. These aren’t edge cases to footnote. They’re baseline screening criteria that belong in any protocol referencing this drug class.
Methods and Assays for Identifying Anti-Obesity Peptides
Computational and wet-lab methods in this field work best in sequence, each one filtering out candidates before the next, more expensive stage.
Molecular docking and virtual screening remain the standard entry point for narrowing large peptide libraries, but docking scores predict binding pose plausibility, not confirmed biological activity. Reviews of in silico-to-in vivo pipelines show that docking-predicted lipase inhibitors held up reasonably well under subsequent testing in several published studies, but that consistency shouldn’t be assumed to generalize automatically to every target class.
In vitro functional confirmation follows. For GPCR-mediated peptides, cAMP accumulation assays and beta-arrestin recruitment assays distinguish true receptor agonism from mere binding. For enzyme-directed candidates, direct inhibition assays against targets like pancreatic lipase or PPAR-gamma reporter assays serve the equivalent purpose.
PK and stability characterization comes next, and this is where DPP-4 resistance testing and ex vivo whole-blood stability assays earn their place, alongside straightforward assessment of aqueous solubility and aggregation propensity under physiological conditions.
Reproducibility standards deserve explicit attention in a field where batch-to-batch peptide variability can quietly undermine otherwise sound experimental design:
- Full sequence disclosure, including any non-natural modifications or stereochemistry.
- Batch certificate of analysis documenting purity, typically via HPLC and mass spectrometry.
- Complete assay condition reporting: buffer composition, temperature, incubation time, and cell line passage number where relevant.
- Storage and handling history for the peptide lot used in each experiment.
Sourcing Research-Grade Peptides for Rigorous Studies
Experimental variability in obesity peptide research often traces back to material quality long before it traces back to assay design. That level of documentation matters because a peptide of uncertain purity can introduce confounding variables into receptor binding assays or in vivo dosing studies that no amount of careful statistical analysis can fully correct after the fact.
Consistent batch-to-batch supply also reduces a quieter source of noise: re-ordering material from a variable source mid-study can shift baseline potency without the researcher ever suspecting the peptide itself changed. For labs working on incretin-pathway and multi-agonist research specifically, Blankpeptides’ catalog includes AOD-9604, RETATRUTIDE, and TIRZEPATIDE, each sold strictly for laboratory research use, not for human or animal consumption.

Where Obesity Peptide Research Should Focus Next
The incretin story has been so successful that it risks crowding out investment in mechanistically distinct alternatives, and that’s a real strategic risk for the field, not just an academic observation. Multi-agonist compounds keep pushing efficacy numbers higher, but they’re all drawing from the same well of gut-brain signaling biology, which means they likely share failure modes we haven’t fully mapped yet.
Reproducibility deserves more attention than it gets. Too many preclinical peptide papers report efficacy without disclosing enough assay metadata for another lab to confirm the finding independently. Standardized reporting, sequence, purity, assay conditions, should be a submission requirement, not a courtesy.
The most useful work happening right now sits at the intersection of peptide chemistry, pharmacokinetic engineering, and clinical physiology, exactly the kind of collaboration that turns a 12% mouse result into something worth testing in humans.
— Blank Research Team
Get Research-Grade Peptides for Your Obesity Studies
Sourcing inconsistent material is one of the fastest ways to introduce noise into an otherwise well-designed obesity peptide research protocol.
The catalog covers the compounds most relevant to current obesity pharmacology research, including AOD-9604 for GH-fragment studies, RETATRUTIDE for tri-agonist and comparative PK/PD work, and TIRZEPATIDE for GIP/GLP-1 co-agonism research. All products ship strictly for laboratory research use to qualified researchers aged 21 and older. If your lab needs a dependable source for your next obesity peptide research protocol, browse the Blankpeptides catalog and request the COA for your batch before you order.
Further Reading and Primary Sources
For deeper verification, the ScienceDirect review on peptide-based therapies covers STEP and SURMOUNT trial data in full. The PMC review of obesity peptide classes offers broader mechanistic context, while the preclinical BRP and D3 report and the azapeptide GLP-1 engineering study detail specific experimental findings. For epidemiologic grounding, the CDC’s obesity prevalence data remains the standard public reference.
This article is general information, not a substitute for advice from a qualified doctor. Consult a qualified healthcare professional about your own circumstances before acting on anything here.
Sources
Verify Peptide Solvent COAs and Drying Data for Research Labs
Headspace gas chromatography under USP <467> is the accepted standard for detecting volatile residual solvents in synthetic peptides. Expect a COA that names the method, reports levels for solvents like DMF, DCM, NMP, acetonitrile, and ethanol, and documents the drying cycle used to remove them. Without that drying and validation record, a passing solvent number tells you less than it seems to.
TL;DR:
- Residual solvents like DMF, DCM, and acetonitrile are present inherently from synthesis and purification, making their detection complex yet critical.
- Proper drying and validation of the lyophilization process are essential because trapped solvents can cause false-negative results during headspace GC testing.
- Validated headspace GC methods should specify their LOQ, include solvent-specific limits, and be supported by thorough method validation for accurate results.
- HS-GC cannot detect nonvolatile residues or elemental impurities, which require supplementary methods such as LC-MS or ICP-MS for comprehensive testing.
- Trustworthy Certificates of Analysis must document specific testing methods, drying parameters, measured ppm values, and comparison against solvent class limits to verify purity claims.
Table of Contents
- Where Residual Solvents Enter Peptide Synthesis
- How USP <467> Headspace GC Actually Works
- Sample Prep and Drying: Where Results Go Wrong
- ICH Q3C and USP <467>: How Limits Get Set
- What Headspace GC Misses
- What a Trustworthy COA Should Actually Show
- Checking Solvent Documentation on Blank Peptides Products
- Where to Verify the Standards Yourself
- Sources
Where Residual Solvents Enter Peptide Synthesis
Most solvent contamination traces back to two stages: synthesis and purification. Solid-phase peptide synthesis (SPPS) runs on DMF and NMP as swelling and coupling solvents, and cleavage cocktails often bring in dichloromethane (DCM) alongside trifluoroacetic acid. These aren’t trace contaminants introduced by accident. They’re the working fluids of the entire process, present in gram quantities before purification even starts.
Purification adds its own layer. Reversed-phase HPLC and UPLC mobile phases lean heavily on acetonitrile, and purification chemistry choices at this stage directly shape downstream solvent burden. Workup, recrystallization, lyophilization, and even packaging materials contribute smaller but real amounts.
For routine testing, prioritize by volume and toxicity, not just by what’s easiest to detect:
- DMF and NMP: high-volume SPPS solvents, moderate toxicity concern
- DCM: cleavage-stage residue, Class 2 solvent under most schemes
- Acetonitrile: purification carryover, present in nearly every reversed-phase workflow
- Ethanol and isopropyl alcohol (IPA): lower-risk but worth confirming, especially after recrystallization steps
How USP <467> Headspace GC Actually Works
Static headspace GC exploits a simple physical principle: heat a sealed sample vial until volatile solvents partition out of the peptide matrix and into the vapor space above it, then sample that vapor directly. No liquid injection, no solvent extraction step to introduce error. The technique is why HS-GC has become the default choice for volatile organic impurities across the pharmacopeial world.
Two detector choices matter here, and they solve different problems:
- GC-FID (flame ionization detection) handles routine quantification. It’s fast, sensitive to organic compounds, and the workhorse for confirming a solvent falls under its specification limit.
- GC-MS (mass spectrometry detection) earns its place when identity is in question. If a peak shows up that doesn’t match a known reference standard, or a matrix is unusually complex, mass spectral confirmation removes the guesswork.
Method validation snapshot: A properly validated HS-GC method, built around ICH Q2 parameters, reports specificity, linearity, accuracy, precision, and a defined limit of quantitation, typically expressed in parts per million (ppm) or percent weight-by-weight. Results below that reported LOQ should be stated as such, not left blank.
Escalate to GC-MS or a custom method when volatility is borderline, when a solvent isn’t on the standard reference list, or when the sample matrix (a capsule formulation, for instance, rather than a lyophilized cake) behaves unpredictably during headspace equilibration. A lab that can’t tell you its LOQ for a specific solvent hasn’t finished validating the method.
Sample Prep and Drying: Where Results Go Wrong
Lyophilized cakes and reconstituted solutions behave differently under headspace analysis, and that difference matters more than most researchers assume. A porous, poorly characterized cake can trap solvent unevenly throughout its structure. Sampling from one spot instead of a representative subsample can understate the true residual level by a meaningful margin.
Drying cycle design drives the outcome just as much as the analytical method does:
- Shelf temperature and ramp rate during primary and secondary drying
- Vacuum level maintained throughout the cycle
- Hold time at final drying temperature
- Endpoint verification, not just a fixed clock time
Pro Tip: Ask any supplier for the actual drying cycle parameters, not just a statement that the product was “lyophilized.” A cycle that hits temperature but skips a defined hold time at low vacuum is the single most common reason a peptide passes visually but carries elevated trapped solvent.
Interpreting a trace HS-GC readout also means knowing your LOQ. A “not detected” result only means the solvent fell below the method’s sensitivity floor, not that it’s absent.
ICH Q3C and USP <467>: How Limits Get Set
ICH Q3C sorts solvents into three classes based on known toxicity, and that classification drives everything downstream. Class 1 solvents (benzene, carbon tetrachloride, and similar compounds) should be avoided entirely in synthesis where feasible. Class 2 solvents, including DMF, DCM, and NMP, carry defined permitted daily exposure (PDE) limits and need quantitative controls. Class 3 solvents, ethanol and IPA among them, carry low toxicity concern and get simpler treatment.
USP <467> structures the actual workflow: identify which solvents are plausibly present based on the manufacturing process, then quantify each against its class-appropriate limit. The PDE concept ties a numeric limit to a real toxicological endpoint and expected route of administration, which is why a specification written for an injectable drug substance differs from one written for a topical formulation.
The practical takeaway for research peptide specifications:
- Specify testing for solvents actually used in that specific synthesis route, not a generic panel
- Weight limits toward Class 2 solvents present at the cleavage and coupling stages
- Treat Class 3 solvents as lower priority but don’t skip them entirely
- Align limits with process capability so a spec is achievable, not just aspirational
This risk-based logic beats a one-size-fits-all solvent panel because it tests for what’s actually there.
What Headspace GC Misses
HS-GC is excellent at its job and blind to everything outside it. It doesn’t detect nonvolatile scavengers used in cleavage cocktails, many cleavage reagent byproducts, or elemental impurities from catalysts and reagents. Agilent’s technical guidance on peptide analysis makes clear that LC and LC-MS methods are required to catch these nonvolatile residues, since they never partition into a headspace vial no matter how long you heat it.
For elemental impurities, ICP-MS is the method of choice under ICH Q3D logic, picking up trace metals that HS-GC simply cannot see.
A defensible minimum panel for research peptides combines three approaches:
- HS-GC (USP <467>) for volatile organic solvents
- HPLC/UPLC or LC-MS for nonvolatile scavengers and reagent residues
- ICP-MS for elemental impurities, especially when metal catalysts were part of the synthesis
Trigger expanded testing when a new synthesis route, a new scavenger reagent, or an unusual raw material lot enters the process.
What a Trustworthy COA Should Actually Show
We’re the Blank Research Team, and after reviewing how solvent data gets reported across the industry, a few documentation gaps show up repeatedly. A COA worth trusting names the validated HS-GC method used, states drying cycle parameters from the batch record, and reports measured ppm values against the solvent’s class-appropriate limit, not just a pass/fail checkmark. Independent batch testing, rather than in-house-only verification, adds a layer of confidence that self-reported numbers can’t match on their own.
— Blank Research Team
Checking Solvent Documentation on Blank Peptides Products
Blankpeptides posts a certificate of analysis for every batch, targeting high purity across its catalog. That’s the baseline. What matters for your protocol is what’s actually printed on that COA.

When you pull up a batch record, look for the HS-GC method reference, the specific solvent panel tested (not a generic “residual solvents: pass” line), the measured ppm values against each solvent’s limit, and a note on drying or lyophilization parameters. If a supplier can’t produce that level of detail on request, treat the purity claim with skepticism regardless of the number on the label.
Several product pages are worth checking directly for this documentation. Start with KISSPEPTIN and SEMAX, both of which list batch-specific COA access. The CJC-1295 / Ipamorelin blend page shows similar documentation for a combination product, where solvent tracking gets more complex. GLOW, BPC-157 capsules, Selank, and Hospira Bacteriostatic Water round out the catalog for researchers building out a full protocol. Pull the COA before you order, compare it against the method expectations covered above, and you’ll know within minutes whether the documentation matches the purity claim.
Where to Verify the Standards Yourself
- USP <467> FAQ, for the official headspace GC workflow
- Separations (2024) review on peptide purification, for emerging purification methods and solvent profile shifts
Consult the full monograph text before validating a transfer method. These summaries orient you; they don’t replace the primary documents.
Sources
Catch 10% B12 Adducts: Tirzepatide Purity Checks for Labs
Below 95%, don’t use it for anything but the most preliminary screening. But the percentage alone tells you almost nothing about identity or net content. The single non-negotiable step is orthogonal confirmation: LC-MS/MS mass identity plus a quantitative net-peptide assay, tied to a lot-matched Certificate of Analysis. The FDA has flagged unapproved “research-grade” GLP-1 products as an active safety concern, which makes independent verification a research necessity, not a courtesy.
TL;DR:
- Most tirzepatide products require orthogonal confirmation, like LC-MS/MS and net peptide assays, to verify identity and purity, as visual HPLC purity alone is insufficient.
- High purity measurements around 99.7% are common, but actual net peptide content can vary due to moisture and residual salts, making independent testing essential.
- Vendors should provide detailed COAs with raw chromatograms and MS spectra; relying solely on a summary purity number risks accepting contaminated or mislabeled material.
- Unexpected impurities, such as B12 adducts or mis-acylation, can be present at significant levels and may escape detection unless specifically tested for with appropriate methods.
- When sourcing tirzepatide, demand verified lot-specific documentation, raw data access, and strict shipping controls to ensure material quality and reproducibility.
Table of Contents
- What Does Tirzepatide Purity Actually Measure?
- Which Analytical Methods Confirm Tirzepatide Quality?
- What Impurities Show Up in Tirzepatide, and How Do You Catch Them?
- How Do You Evaluate a Certificate of Analysis?
- How Should a Lab Verify a Vendor’s Purity Claims?
- What Should Procurement Teams Require From Suppliers?
- The Verification Gap Nobody Talks About
- Where to Source Verified Tirzepatide for Research
- Sources
What Does Tirzepatide Purity Actually Measure?
HPLC purity is an area percentage, not a mass measurement. A detector integrates peaks across a chromatographic run and reports the main peak as a percentage of total absorbing area. That number can look excellent while telling you nothing about compounds that don’t absorb UV light at the wavelength used, and it says nothing about how many actual milligrams of peptide are in the vial.

Different research applications tolerate different risk. A 95 to 98% purity peptide might be acceptable for early assay development or dose-finding pilots. An aggregate review of 485 Certificates of Analysis across 19 labs found a mean HPLC purity around 99.7%, with a standard deviation of about 1.0%, which shows that high purity is achievable and increasingly the market norm, not a premium outlier.
Net peptide content is the second, separate number you need. Moisture and residual counterions (acetate or trifluoroacetate salts, typically) can account for a meaningful share of a vial’s weight without contributing any active peptide.
When a shipment arrives, log four things immediately:
- Labeled milligram quantity per vial
- COA-reported HPLC purity and lot number
- Storage conditions specified by the vendor
- Date of manufacture and expiration or retest date
Which Analytical Methods Confirm Tirzepatide Quality?
RP-HPLC or UHPLC remains the primary purity assay, but the column matters more than most labs assume. Tirzepatide carries a C20 fatty diacid side chain that behaves very differently from unmodified peptides on a standard 100 to 130 Å small-molecule column. Wide-pore, peptide-optimized stationary phases (roughly 300 Å) with shallow gradients resolve deletion sequences and acylation variants that a generic method will miss entirely, according to contract lab guidance on tirzepatide testing.
A practical workflow, in order:
- Run RP-UHPLC on a wide-pore peptide column to establish area percent purity and flag secondary peaks.
- Follow with high-resolution LC-MS/MS to confirm molecular identity and catch co-eluting impurities that share retention time with the main peak but differ in mass.
- Run a quantitative net-peptide assay (amino acid analysis or a validated UPLC method) to reconcile labeled milligrams against actual content.
- Test for endotoxin (LAL assay) and sterility when the material will touch any cell-based or in vivo system, and screen for residual solvents from synthesis.
Validated LC-MS/MS bioanalytical methods for tirzepatide already exist for pharmacokinetic quantitation in plasma and can be adapted for identity confirmation in a QC context. Method validation should track ICH Q2(R1) and ICH Q6B parameters: linearity, precision, limit of detection, and limit of quantitation.
Pro Tip: *Ask any vendor for the raw chromatogram, not just the summary purity number.
What Impurities Show Up in Tirzepatide, and How Do You Catch Them?
The most consequential recent finding involves combination products. Independent testing of compounded tirzepatide mixed with B12 analogs identified a previously uncharacterized tirzepatide-B12 adduct present at levels up to roughly 10% of total polypeptide content, with some samples showing potency as low as 43% of label claim. That adduct can survive denaturing MS conditions, meaning a superficial mass check might not flag it as foreign material at all.
Beyond combination-product risk, watch for:
- Deletion sequences, where a residue is missing during synthesis, detectable by MS as a mass shift matching the missing amino acid.
- Oxidation products, common at methionine or tryptophan-adjacent positions, appearing as a mass increase of roughly 16 daltons per oxidation event.
- Mis-acylation, where the fatty diacid chain attaches to the wrong site, often coeluting closely with the parent peak on standard gradients.
- Underfill, where percent purity looks clean but net content assay reveals fewer actual milligrams than labeled.
How Do You Evaluate a Certificate of Analysis?
A COA worth trusting states its method, not just its result. Request these elements before you accept any lot:
- Method details — column type, gradient profile, detection wavelength, and instrument model.
- Mass confirmation — an MS spectrum or summary showing observed mass against theoretical mass for tirzepatide.
- Net peptide content — a quantitative assay result, not just HPLC area percent.
- Endotoxin and sterility data — particularly for anything used in cell culture or in vivo work.
- Lab identity and lot match — the testing lab’s name, and confirmation the COA’s lot number matches the vial in hand.
Total impurity thresholds matter more than any single named peak. If a vendor hesitates to provide raw chromatograms or MS spectra on request, treat that as your answer: complete testing documentation is the baseline, not an upgrade.
How Should a Lab Verify a Vendor’s Purity Claims?
Run your own confirmation loop rather than taking any single document at face value. Document the shipment on arrival, reconstitute a sample under controlled conditions, and run it through RP-UHPLC on a wide-pore peptide column before touching LC-MS/MS for identity. Follow with an endotoxin screen and a net-content assay, then compare every result against the vendor’s own COA line by line.
A trustworthy vendor QC package includes a lot-specific COA, independent LC-MS/MS confirmation rather than in-house-only testing, documented endotoxin results, and a quantitative content assay.
- Document lot number, arrival condition, and storage temperature immediately.
- Reconstitute per vendor instructions before any assay.
- Reserve a split sample for independent contract lab testing if in-house instrumentation is limited.
- Escalate to a third-party lab whenever MS data is missing or ambiguous.
Pro Tip: Submit reconstituted and lyophilized splits together when sending samples to a contract lab. Purity can shift measurably between the two, and side-by-side data tells you whether your storage or handling introduced the discrepancy.
What Should Procurement Teams Require From Suppliers?
Contract terms should lock in verification rights before payment, not after a problem surfaces. Require lot-matched COAs delivered with every shipment, documented testing methods rather than a bare purity number, and temperature-controlled shipping with data logging for anything cold-chain sensitive.
- Insist on a written policy for returns or independent sample testing before final payment clears.
- Require raw data (chromatograms, MS spectra) be available within a defined turnaround, not “on request with no timeline.”
- Walk away from any vendor that offers only a single HPLC percentage with no method, no lab name, and no mass confirmation.
- Keep a COA archive tied to batch tracking numbers so any downstream result can be traced back to its verification record.
Recordkeeping isn’t paperwork for its own sake. When a result doesn’t reproduce six months later, a complete COA archive is usually the fastest way to find out whether the peptide or the protocol was the problem.
The Verification Gap Nobody Talks About
The biggest failure we see in lab verification isn’t a bad vendor. It’s a good vendor’s COA taken at face value because the number on the page looked clean.
Raw data access changes the calculus entirely. A lab that can pull the actual chromatogram and MS trace behind a stated purity number catches co-eluting impurities and mass-shifted adducts long before they contaminate a dataset. That access should be the baseline expectation for every procurement decision involving tirzepatide, not a special request reserved for when something already looks wrong.
— Blank Research Team
Where to Source Verified Tirzepatide for Research
Verification only matters if the material behind it holds up, and that’s the standard the provider builds around: USA manufacturing, independent lab verification on every batch, and a COA available per lot rather than per product line. It’s the baseline researchers get to check against raw chromatogram and MS data on request.
The catalog extends beyond tirzepatide into the compounds researchers request alongside it, including KLOW, VIP, DSIP, BPC-157 capsules, CJC-1295 / Ipamorelin, Kisspeptin, Semax, and GLOW. Every listing carries the same documentation standard, so a lab building a multi-compound protocol isn’t stitching together verification from five different suppliers with five different QC baselines.
If your lab needs raw data before committing to a purchase order, request the COA and supporting chromatograms directly through the product page before you order. That can be a way to confirm a lot meets your protocol’s threshold before it ever reaches your bench.
Sources
HPLC vs LC-MS: Cut Verification From Weeks to Days for Peptide QC
Use HPLC with UV or PDA detection for routine purity checks and quantitation, where parts-per-million sensitivity is enough and cost matters. Switch to LC-MS when you need to confirm identity or chase unknowns at parts-per-billion levels, and move to LC-MS/MS (triple quad) for trace quantitation down to parts-per-trillion. The main catch: LC-MS demands cleaner samples, volatile buffers, and dedicated consumables. Most labs run both, with HPLC handling routine release testing and LC-MS confirming identity or impurities.
TL;DR:
- Use HPLC with UV or PDA detection for routine purity testing at parts-per-million sensitivity, especially when cost and speed are priorities.
- Switch to LC-MS or LC-MS/MS for identifying unknowns or detecting trace impurities at parts-per-billion to parts-per-trillion levels, requiring cleaner samples and volatile buffers.
- Transitioning from HPLC to LC-MS demands tighter sample filtration, low-contamination consumables, and replacement of non-volatile buffers to avoid instrument damage.
- LC-MS systems are significantly more expensive to operate and maintain, with higher requirements for specialist service and pure reagents, but offer higher sensitivity for complex matrices.
- Analytical confidence increases when using certificates of analysis for known peptides, enabling faster method validation and more reliable LC-MS confirmation.
Table of Contents
- HPLC vs LC-MS: What Actually Separates the Two Technologies
- When Should You Use HPLC vs LC-MS?
- Moving a Method From HPLC to LC-MS: What Breaks and Why
- What Do HPLC and LC-MS Cost to Run Day to Day?
- What Does the Literature Say About Choosing Between Them?
- Blank Research Team Perspective: Building a Peptide QC Workflow That Holds Up
- PT 141 and Analytical Confidence You Can Verify
- Sources
HPLC vs LC-MS: What Actually Separates the Two Technologies
The dominant confusion in “HPLC vs LC-MS” comparisons comes from a basic misread: HPLC isn’t a competitor to LC-MS, it’s a component of it. Both techniques push a sample through a liquid mobile phase across a chromatographic column. Where they part ways is detection.
HPLC typically pairs with a UV or photodiode array (PDA) detector, measuring how much light a compound absorbs in a given wavelength. It’s fast, cheap, and reliable for compounds with a strong chromophore. But it has a blind spot: if two compounds absorb light similarly and elute at close retention times, HPLC sees one blended peak. It has no way to tell you what’s actually in it.
LC-MS solves that by replacing (or supplementing) optical detection with mass detection. After separation, the eluent passes through an ionization source, usually electrospray ionization (ESI), and a mass analyzer sorts ions by mass-to-charge ratio. That gives you a molecular fingerprint, not just a light-absorption signature. Co-eluting compounds that look identical on a UV trace often resolve cleanly by mass. Add a second mass analyzer, as in LC-MS/MS (tandem MS), and you can fragment a precursor ion and confirm structure from its breakdown pattern, something HPLC simply cannot do.
The sensitivity gap between the two is where this decision usually gets made in practice:
- HPLC (UV/PDA): reliable for routine purity and potency work at higher concentration levels.
- LC-MS (single quad): extends detection to lower levels, useful for trace impurities and unknown identification.
- LC-MS/MS (triple quad): offers the highest sensitivity for trace-level quantitation in complex matrices.
Sensitivity, in plain terms: moving from HPLC to LC-MS/MS represents a jump of several orders of magnitude in detection limits. A contaminant invisible on a UV trace at ppm levels can show up clearly on a triple quad running at ppt sensitivity.
That gap is why clinical and forensic toxicology work leans so heavily on tandem MS. The literature on LC-MS in clinical biochemistry documents that accurate quantitation at these low concentrations depends on managing matrix effects, using stable isotope internal standards to correct for ion suppression rather than assuming a clean signal.
When Should You Use HPLC vs LC-MS?
Matching the technique to the task saves both money and time. Here’s the practical breakdown, framed as a decision sequence you can actually apply at the bench:
- Do you need routine quantitation on a validated method with a known analyte? Use HPLC with UV/PDA. It’s cheaper, faster to run, and the standard regulatory bodies still recognize for release testing.
- Do you need to confirm identity or detect an unknown compound? Use LC-MS. Mass detection gives you structural confidence that optical absorbance cannot.
- Do you need trace-level quantitation in a complex biological or environmental matrix? Use LC-MS/MS. Nothing else reaches parts-per-trillion reliably.
- Do you need both routine numbers and identity confirmation? Run HPLC for the primary quantitative result, then confirm with LC-MS, a workflow that’s common practice for generating complementary data for certificates of analysis.
The matrix you’re working with often makes the decision for you. Plasma, serum, urine, and environmental extracts carry enough background interference that optical detection alone gets unreliable fast, which is why toxicology and metabolomics labs default to LC-MS. Clean formulations and high-concentration active pharmaceutical ingredients, by contrast, rarely need mass detection at all.
It’s also worth noting that validated HPLC/UV methods remain the accepted standard in many regulatory filings, precisely because they’re simpler to validate, transfer between labs, and maintain over a product’s lifecycle. LC-MS earns its place when the analytical question outgrows what optical detection can answer, not as a default upgrade.
Moving a Method From HPLC to LC-MS: What Breaks and Why
Migrating an existing HPLC method to LC-MS is where most labs run into avoidable trouble. The chromatography often stays similar. The sample handling and mobile phase chemistry usually cannot.
Start with filtration. A 0.45 µm filter is often fine for HPLC, where particulate matter mostly just risks clogging a column frit. For LC-MS, tighten that to 0.22 µm. Finer particulates and micro-aggregates that never bothered a UV detector can foul an ESI capillary or contribute background noise that swamps a low-abundance signal.
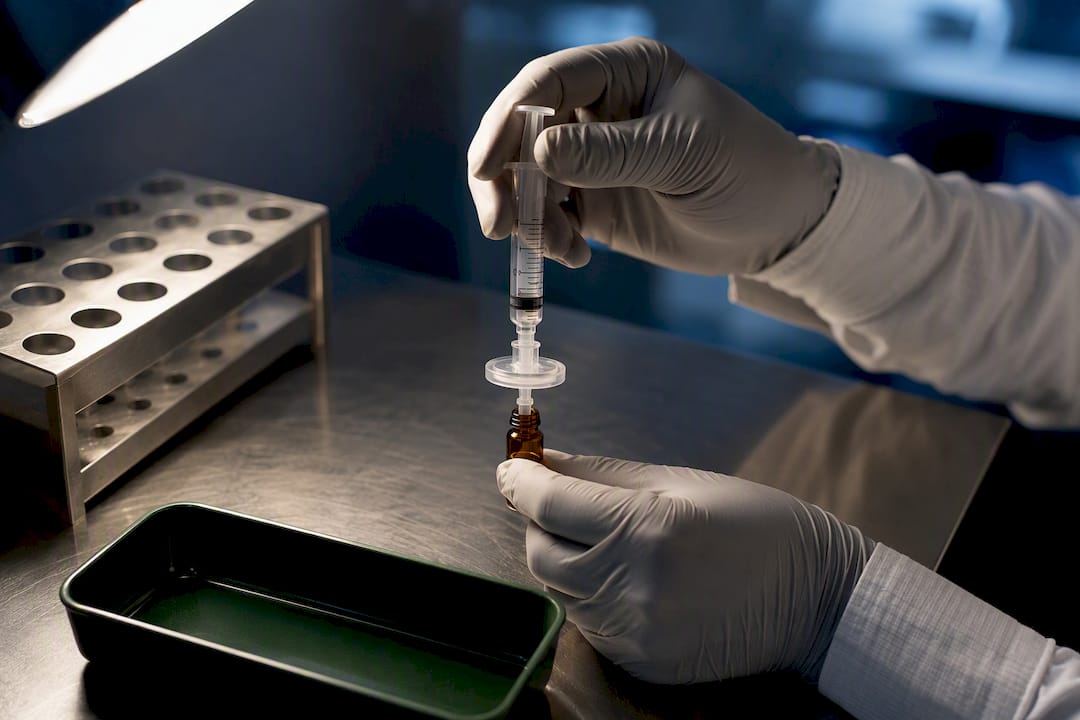
Consumables matter more than most method-development checklists admit. Certified low-background Type 5.0 glass vials, bonded caps that don’t leach plasticizers, and low-extractable syringe filters all exist because cheap alternatives introduce ghost peaks and contaminants that are invisible on HPLC but show up as real interference on a mass spectrometer. Solvent grade follows the same logic: LC-MS grade solvents are tested specifically for low background and minimal ion-suppression potential, something a standard HPLC-grade solvent was never screened for.
Buffer chemistry is the pitfall that catches the most labs off guard. Phosphate buffers, common and well-behaved in HPLC, will precipitate inside an MS ion source and can damage the instrument over time. Before converting any HPLC method, replace non-volatile buffers with volatile alternatives, ammonium formate, ammonium acetate, or formic acid, and revalidate the method rather than assuming equivalent performance.
- Filter samples at 0.22 µm for LC-MS work, not the 0.45 µm often acceptable for HPLC.
- Use certified low-background vials and bonded caps to avoid extractable contamination.
- Source LC-MS grade solvents specifically, not general HPLC-grade reagents.
- Convert phosphate or other non-volatile buffers to ammonium acetate, ammonium formate, or formic acid before running LC-MS.
Pro Tip: If you’re seeing inconsistent quantitation or unexplained signal loss, run a post-column infusion experiment to check for ion suppression before you blame the method. Matrix components co-eluting with your analyte are a far more common culprit than instrument drift, and stable isotope internal standards will usually expose the problem fast.
What Do HPLC and LC-MS Cost to Run Day to Day?
Capital cost is the first fork in the road. A well-equipped HPLC system with UV/PDA detection runs a fraction of what a triple quadrupole LC-MS/MS system costs, and that gap holds up on the operating side too. LC-MS demands ultra-pure solvents, service contracts for the mass analyzer and vacuum system, and specialized replacement parts that a standard HPLC lab never budgets for.
Maintenance burden diverges the same way. HPLC upkeep centers on lamp replacement, seal wear, and column care, tasks most bench scientists handle without outside help. LC-MS maintenance adds ion source cleaning, vacuum pump servicing, and periodic calibration that often requires a trained specialist, part of why LC-MS instrumentation is documented as requiring more skilled operators and more complex upkeep than HPLC despite becoming more routine across clinical and metabolomics labs.
Throughput cuts both ways. LC-MS can quantify many analytes in a single run, a real advantage for panel testing, but method optimization to avoid ion suppression takes real setup time upfront.
- Budget for LC-MS grade solvents and consumables as a recurring line item, not a one-time purchase.
- Factor in revalidation time whenever converting a buffer system for MS compatibility.
- Plan for specialist service visits on the mass analyzer separately from routine HPLC maintenance schedules.
What Does the Literature Say About Choosing Between Them?
Peer-reviewed toxicology and clinical chemistry literature is consistent on one point: mass detection earns its cost premium when the analytical question demands it, not by default. LC-MS/MS delivers sensitivity, specificity, and multi-analyte capacity that HPLC-UV and immunoassays cannot match, which is why it’s become standard in therapeutic drug monitoring and forensic toxicology despite the added method optimization burden.
Matrix effects, particularly ion suppression and enhancement, remain the primary variable separating a reliable LC-MS result from a misleading one. Tandem MS combined with stable isotope internal standards is the accepted way to control for it.
A disciplined approach is important for analytical support.
Blank Research Team Perspective: Building a Peptide QC Workflow That Holds Up
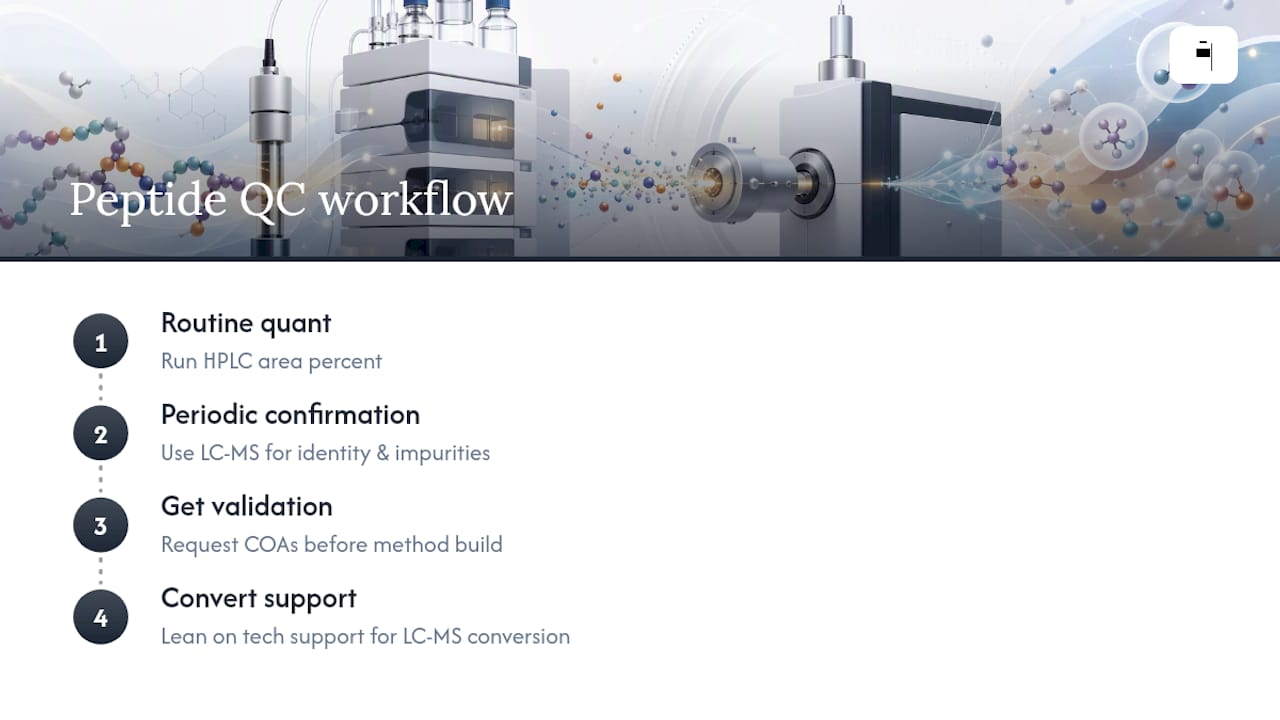
The workflow we recommend is straightforward: run HPLC area percent as the routine quantitative backbone, then confirm identity and impurity profile with periodic LC-MS analysis. Neither technique alone gives you the full picture for peptide research materials.
What gets underappreciated is how much validation work a solid certificate of analysis removes upfront. If a supplier hands you traceable batch data and independent purity verification, you’re not starting your LC-MS confirmation from zero. Request COAs before you build a method, and lean on technical support when converting an existing HPLC protocol for mass detection.
— Blank Research Team
PT 141 and Analytical Confidence You Can Verify
Peptide research critically depends on knowing exactly what’s in the vial. PT 141 is offered with available certificates of analysis providing batch-specific data to assist LC-MS confirmation runs.
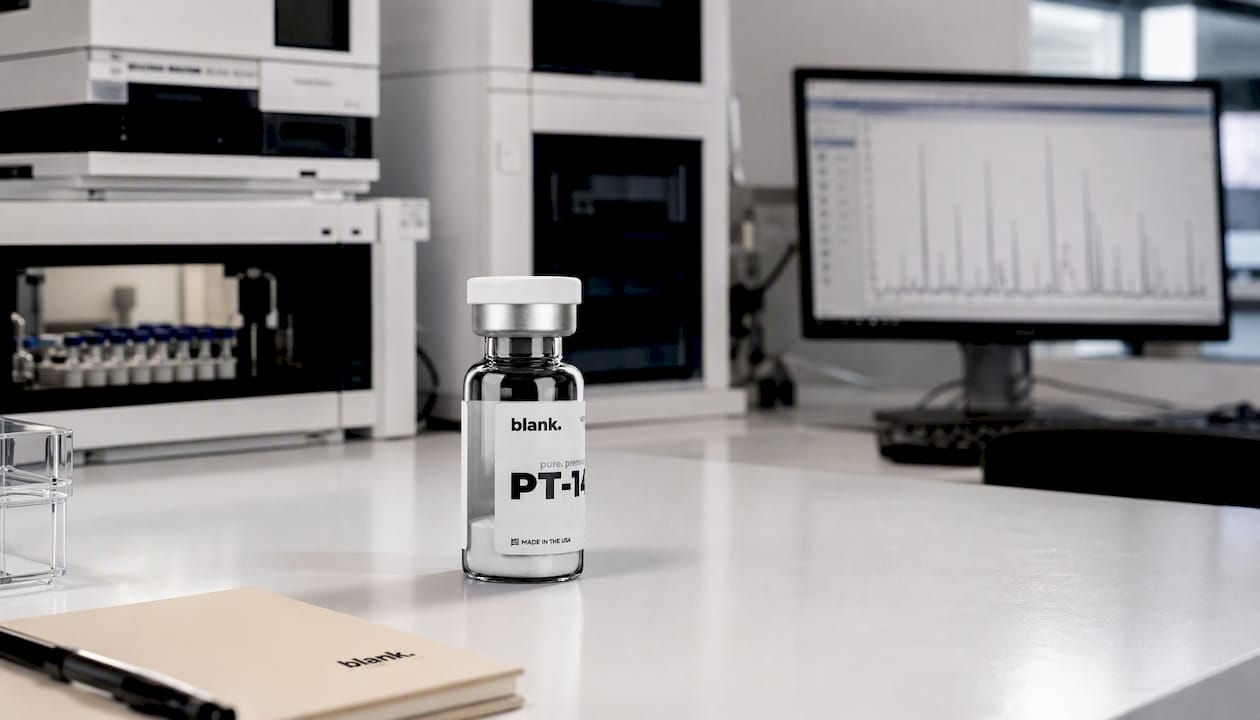
That documentation shortens method verification meaningfully. Instead of building an identity confirmation workflow from an unknown starting point, you’re checking a known reference against traceable material. For labs running combined HPLC/LC-MS QC on peptide research compounds, that head start on validation is the difference between weeks and days. Visit the PT 141 product page to review available certificates of analysis or contact technical support for assistance with LC-MS confirmation methods.
Sources
For deeper technical grounding, review the clinical biochemistry literature on LC-MS principles, solvent-grade guidance for LC-MS workflows, and LC-MS/MS applications in drug development. For product specifics and current certificates of analysis, visit Blankpeptides.