The immediate move: confirm the COA states its HPLC method and pairs it with mass spectrometry identity, and if the work is critical, run a quick RP‑HPLC check the day the vial arrives. USP’s compendial guidance and Blank Research Team’s own lab protocol both treat this as the baseline, not an optional extra.
TL;DR:
- Ensure the certificate of analysis includes a chromatogram image, column and gradient details, detection wavelength, and MS intact mass with accuracy.
- Use orthogonal testing methods such as RP‑HPLC, LC‑MS, MALDI‑TOF, and AAA to fully verify peptide identity, purity, and content.
- Recognize that a 98% HPLC purity may still mean only around 82% actual peptide mass due to residual salts and water.
- Match your required purity level to your application, with high-precision work demanding above 99% purity and orthogonal verification.
- Verify peptide integrity upon arrival with a visual check, multiple HPLC runs, and mass confirmation, then compare results to the vendor’s COA for consistency.
Table of Contents
- What documentation should you require before trusting a peptide batch?
- RP‑HPLC, LC‑MS, MALDI‑TOF, or AAA: which method answers which question?
- Why does a 98% purity peptide sometimes contain far less usable peptide mass?
- What purity level does your application actually require?
- How should you verify a peptide the day it arrives?
- Blank Research Team’s take on procurement and reproducibility
- Where Blank Peptides fits into a verification-first lab
- Sources
What documentation should you require before trusting a peptide batch?
A certificate of analysis is only as useful as what it discloses. Before accepting a batch for anything beyond casual screening, pull the COA and check it against a short list of non-negotiables.
- Chromatogram image: a visible trace, not just a summary number, so you can see peak shape and baseline noise.
- Column and gradient details: the stationary phase and mobile phase gradient used to generate the purity figure.
- Detection wavelength: 214 nm or 220 nm, stated explicitly, since the two wavelengths bias impurity visibility differently.
- Integration parameters: how the software drew peak boundaries, which affects the reported area percent.
- MS intact mass with instrument accuracy: confirms identity, not just chromatographic cleanliness.
- Peptide content or residual TFA percentage: the figure that converts vial mass into usable peptide mass.
- Water content and its measurement method: karl fischer or another named method, not a vague estimate.
For screening assays, a clean chromatogram and stated wavelength may suffice.
RP‑HPLC, LC‑MS, MALDI‑TOF, or AAA: which method answers which question?
Each of these tools answers a different question, and none of them alone answers all of them. That’s the entire argument for orthogonal testing, not a marketing slogan vendors attach to premium listings.
RP‑HPLC at 214 or 220 nm is the workhorse. A sample runs through a reverse-phase column, and software integrates the area under each peak to generate the familiar area-percent number. It’s fast, reproducible, and tells you almost nothing about what a co-eluting impurity actually is. Two different molecules can share a retention time and hide inside what looks like a single, clean peak. That’s the blind spot RP‑HPLC alone can’t see, and why LC‑MS gets paired with it.
LC‑MS with electrospray ionization (ESI) confirms identity by intact mass and can flag impurities HPLC missed entirely, because it’s reading mass, not just retention time. One catch worth knowing: TFA suppresses ESI ionization, so samples destined for LC‑MS often need desalting or a switch to a volatile acid like formic acid to get a usable signal.
MALDI‑TOF gives a fast identity snapshot, useful for a quick “is this the right molecule” check, but its resolution is coarser. High-resolution LC‑MS instruments report mass accuracy under 5 ppm, while MALDI‑TOF or lower-resolution instruments typically land in the 0.5 to 1 Da range.
Amino acid analysis (AAA), tied to a mass-balance approach, is how you get to absolute peptide content rather than a relative area percent.
| Method | Answers | Blind spot |
|---|---|---|
| RP‑HPLC (214/220 nm) | Relative purity, area percent | Can’t identify co-eluting impurities |
| LC‑MS (ESI) | Identity, intact mass, impurity ID | TFA suppresses signal without desalting |
| MALDI‑TOF | Fast identity check | Lower mass accuracy (0.5 to 1 Da) |
| AAA / mass balance | Absolute peptide content | Slower, more expensive per sample |
Pro Tip: If a vendor can only supply RP‑HPLC data, ask what wavelength was used and whether a duplicate run at a second wavelength is available. A peak that looks clean at 220 nm can show shoulder impurities at 254 nm.
Why does a 98% purity peptide sometimes contain far less usable peptide mass?
HPLC area percent tells you the main peak’s share of everything that eluted and absorbed at the chosen wavelength. It says nothing about how much of that vial’s dry mass is actually peptide versus counterion salt and water.
Here’s how to read a COA without getting misled:
- Locate the HPLC area-percent figure and confirm the column, gradient, run time, and wavelength are all stated, not just the number.
- Locate the peptide content figure (often from AAA or a mass-balance calculation), which reflects true mass, not chromatographic area.
- Check the residual TFA percentage. For basic peptides, TFA counterions can account for 10% to 40% of total vial mass, which is a massive swing when you’re calculating a dose or a molar concentration.
- Check the water content and its measurement method, since residual moisture dilutes the same way TFA does.
- Multiply vial mass by peptide content percentage, not by HPLC area percent, to get true usable peptide mass.
A concrete example: a vial reports high HPLC area purity but lower net peptide content as measured by mass-based methods. On a 10 mg vial, the 98% figure suggests almost no chromatographic impurity, but the 82% content figure means only 8.2 mg is actual peptide. The other 1.8 mg is TFA, water, and trace synthesis byproducts. Every downstream calculation, concentration, dilution, molar ratio, should run off the 82%, not the 98%.
If your in-house RP‑HPLC check disagrees with the vendor’s COA by more than a few percentage points, quarantine the lot, document the discrepancy, and query the vendor before using it in any dose-sensitive work. Retesting is cheaper than a failed experiment traced back to a mislabeled vial three weeks later.

What purity level does your application actually require?
Not every experiment needs the same rigor, and over-testing wastes budget just as surely as under-testing wastes results.
- Screening and qualitative assays: 90% to 95% HPLC purity is often workable, but treat any hit from a low-purity screen as preliminary until confirmed on cleaner material.
- Quantitative dose-response and potency studies: target 95% to 98% HPLC purity plus AAA or a validated content assay, since your EC50 or IC50 numbers are only as good as your concentration math.
- In vivo and regulatory-style research: expect identity confirmation, documented content, and stability data on file, not just a purity percentage on a label.
- High-precision structural work like NMR or crystallography: purity above 99% with orthogonal structural confirmation is the realistic floor, since even minor impurities can distort spectra or block crystal formation.
Matching testing depth to application intent, rather than defaulting to “highest purity always,” keeps both your budget and your data honest.
How should you verify a peptide the day it arrives?
Blank Research Team runs a four-step protocol on incoming lots, and it scales down for routine work or up for anything dose-critical.
- Visual and solubility check. Look for expected color, texture, and clumping; confirm it dissolves as specified in the recommended solvent.
- Triplicate RP‑HPLC injections. Three runs, not one, reporting mean and standard deviation on the main peak. A low relative standard deviation around or below 1% is the practical benchmark for a trustworthy in-house check.
- Intact mass by LC‑MS or MALDI‑TOF. Confirms identity independent of the vendor’s own claim.
- AAA or outsourced mass-balance analysis when stoichiometry drives the experiment, such as dose-response work or anything feeding into a molar calculation.
If your in-house numbers land within a few percentage points of the COA, accept and log the lot. If they diverge meaningfully, quarantine, retest, and send the vendor your data, not just a complaint. A quick HPLC check takes an afternoon; AAA and LC‑MS take longer and cost more, so reserve them for lots where the downstream data actually depends on absolute content.
Pro Tip: Keep a running log of in-house HPLC results by vendor and catalog number. Patterns across lots reveal supplier consistency faster than any single certificate ever will.
Blank Research Team’s take on procurement and reproducibility
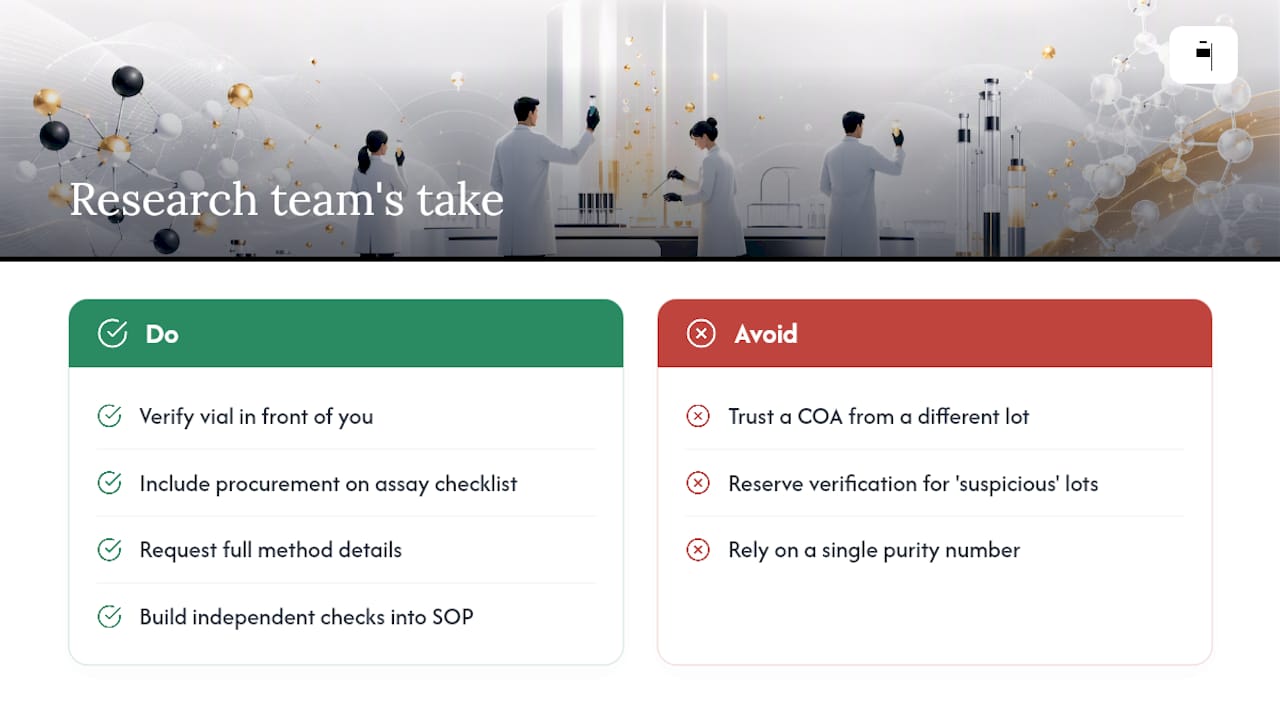
A certificate of analysis is evidence about one lot, not a permanent guarantee about every vial that ships under that catalog number. Treat it as lot-specific testimony, and when a result actually drives a conclusion, verify the vial in front of you rather than trusting the paperwork from a different production run.
Procurement decisions belong on the same checklist as your assay design. A vendor’s willingness to hand over full method details, wavelength, column, gradient, without hedging is a better predictor of reliability than any single purity number. Independent verification shouldn’t be reserved for suspicious lots. Build it into standard operating procedure for anything feeding a publication, a dose-response curve, or a decision you’ll defend later. The gap between reported and actual mass content is exactly where reproducibility problems quietly originate.
— Blank Research Team
Where Blank Peptides fits into a verification-first lab
If everything above sounds like a lot of homework, that’s the point. Most of it disappears when your supplier already publishes the method, the wavelength, and the mass content on every batch instead of making you chase it down.

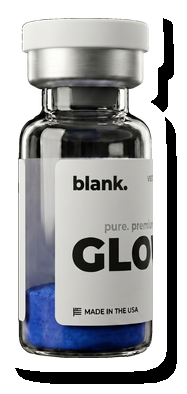
Three catalog entries show what that looks like in practice. KISSPEPTIN suits researchers working on appetite and reproductive signaling pathways who need documented identity and content data on file. GLUTATHIONE fits oxidative stress and cellular research where net peptide mass, not just chromatographic area, determines your dosing accuracy. GLOW is built for researchers running combination or skin-biology studies who still want the same COA transparency across every SKU in their order.
Every batch ships with its own certificate, and every product page links directly to that documentation. Browse the full peptide catalog and check the COA before you order, exactly as this guide recommends. Sales are limited to qualified researchers aged 21 and older, for laboratory research use only.